Ai-specific Server Market Analysis, Size, and Forecast 2026-2030: North America (US, Canada, and Mexico), Europe (Germany, UK, and France), APAC (China, Japan, and India), South America (Brazil and Argentina), Middle East and Africa (Saudi Arabia, UAE, and South Africa), and Rest of World (ROW)

Ai-specific Server Market Analysis, Size, and Forecast 2026-2030:
North America (US, Canada, and Mexico), Europe (Germany, UK, and France), APAC (China, Japan, and India), South America (Brazil and Argentina), Middle East and Africa (Saudi Arabia, UAE, and South Africa), and Rest of World (ROW)

Published: May 2026 327 Pages SKU: IRTNTR80678

Market Overview at a Glance

$769.75 B
Market Opportunity
45.2%
CAGR 2025 - 2030
34.6%
North America Growth
$46.69 B
CPU-based segment 2024

Ai-specific Server Market Size 2026-2030

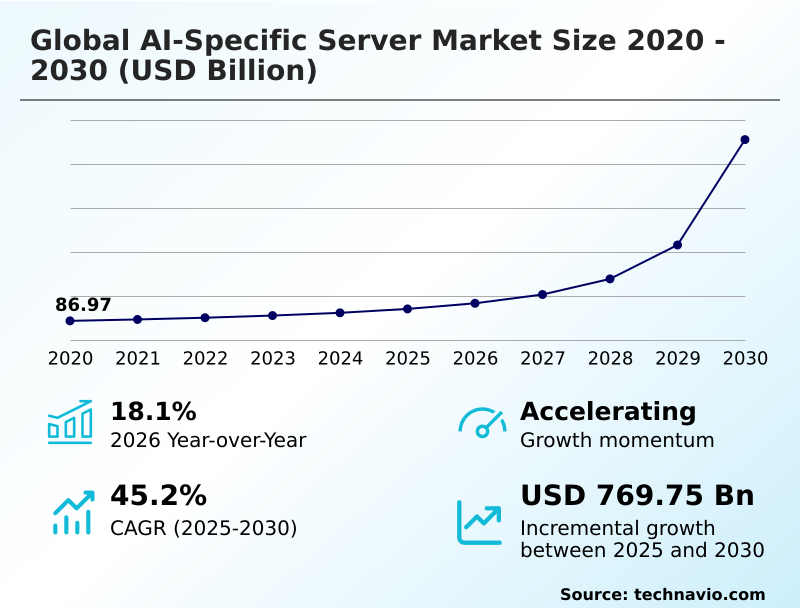
The Ai-specific Server Market size was valued at USD 141.26 billion in 2025, growing at a CAGR of 45.2% during the forecast period 2026-2030.

Major Market Trends & Insights

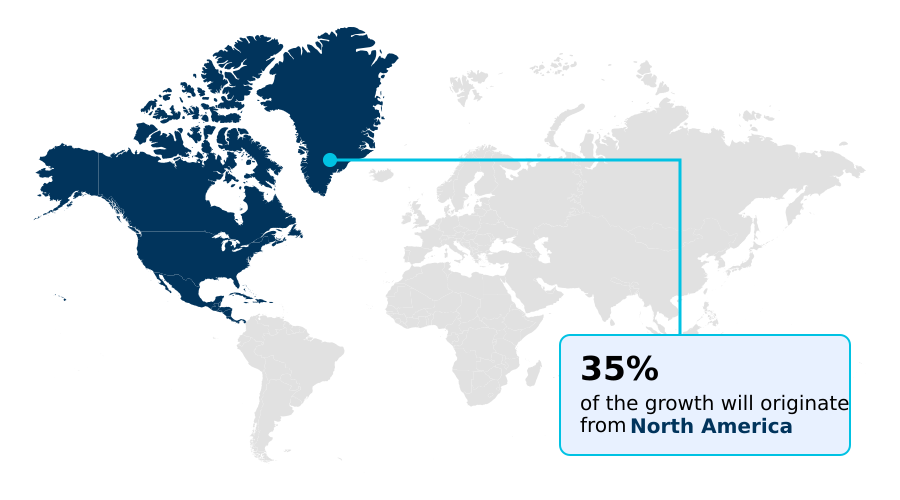
  • North America dominated the market and accounted for a 34.6% growth during the forecast period.
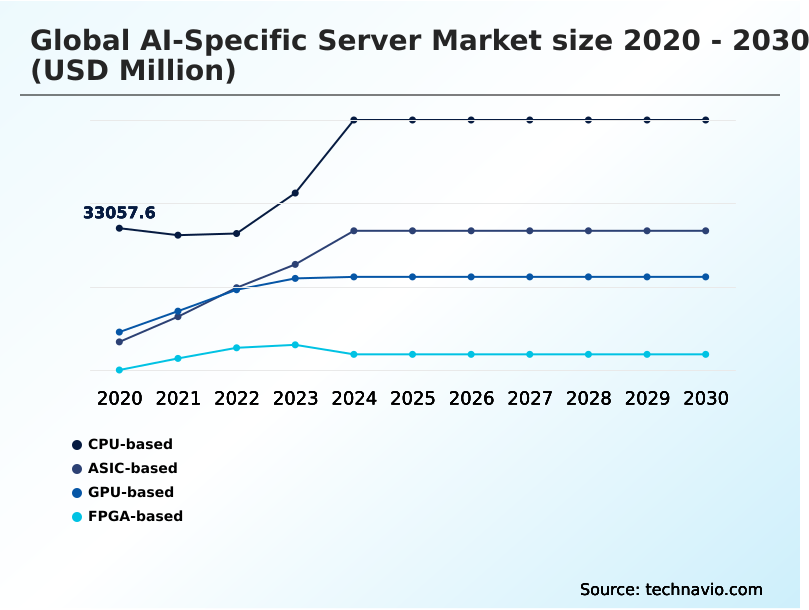
  • By Processor Type - CPU-based segment was valued at USD 46.69 billion in 2024
  • By Component - Hardware segment accounted for the largest market revenue share in 2024

Market Size & Forecast

  • Historic Market Opportunities 2020-2024: USD 824.05 billion
  • Market Future Opportunities 2025-2030: USD 769.75 billion
  • CAGR from 2025 to 2030 : 45.2%

Market Summary

  • The AI-specific server market is defined by a rapid pivot to high-density, liquid-cooled systems, with leading-edge server racks now managing power loads over 120 kilowatts, an 800% increase from traditional designs. This shift is a direct response to the computational demands of generative AI, which require thousands of accelerators to operate in parallel.
  • For instance, a financial services firm implementing these systems for algorithmic trading can reduce model inference latency by up to 60%, enabling faster transaction execution. The primary driver is the industrial-scale deployment of large language models, necessitating advanced interconnects to prevent data bottlenecks.
  • However, this growth is constrained by significant challenges, including semiconductor supply chain fragility and the immense strain these deployments place on regional power grids, which can delay new data center projects.

What will be the Size of the Ai-specific Server Market during the forecast period?

Get Key Insights on Market Forecast (PDF) Request Free Sample

How is the Ai-specific Server Market Segmented?

The ai-specific server industry research report provides comprehensive data (region-wise segment analysis), with forecasts and analysis for the period 2026-2030, as well as historical data from 2020-2024 for the following segments.

  • Processor type
    • CPU-based
    • ASIC-based
    • GPU-based
    • FPGA-based
  • Component
    • Hardware
    • Software
    • Services
  • Deployment
    • On-premises
    • Cloud
  • End-user
    • IT and telecom
    • Automotive
    • BFSI
    • Healthcare
    • Others
  • Geography
    • North America
      • US
      • Canada
      • Mexico
    • Europe
      • Germany
      • UK
      • France
    • APAC
      • China
      • Japan
      • India
    • South America
      • Brazil
      • Argentina
    • Middle East and Africa
      • Saudi Arabia
      • UAE
      • South Africa
    • Rest of World (ROW)

How is the Ai-specific Server Market Segmented by Processor Type?

The cpu-based segment is estimated to witness significant growth during the forecast period.

The CPU-based server segment is evolving beyond general-purpose computing, with modern designs integrating dedicated acceleration blocks that boost inference acceleration performance by over 30%.

While traditionally used for less intensive tasks, new workload-optimized architecture advancements feature instruction sets designed for tensor operations, making them viable for hybrid cloud AI deployments and digital twin simulation.

The versatility of x86 and ARM architectures allows enterprises to leverage existing software ecosystems for their enterprise AI platform, reducing redevelopment costs by up to 25%.

This adaptability is critical for edge computing node applications, where power constraints and the need for parallel processing architecture alongside light AI tasks favor the flexibility of a CPU, including those with tensor processing unit capabilities.

Request Free Sample

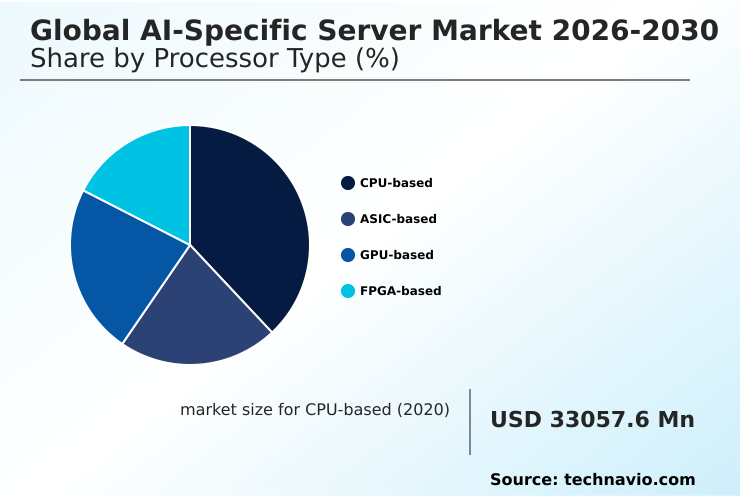
The CPU-based segment was valued at USD 46.69 billion in 2024 and showed a gradual increase during the forecast period.

Request Free Sample

How demand for the Ai-specific Server market is rising in the leading region?

North America is estimated to contribute 34.6% to the growth of the global market during the forecast period.Technavio’s analysts have elaborately explained the regional trends and drivers that shape the market during the forecast period.

See How Ai-specific Server Market demand is rising in North America Request Free Sample

North America leads the AI-specific server market, contributing approximately 34.6% of the incremental growth, primarily driven by hyperscale data center expansions in the United States, which outpaces all other countries in compute capacity investment.

In contrast, APAC is the fastest-growing region with a CAGR of 49.3%, where sovereign AI initiatives in China and India are fueling demand for localized hardware. This divergence is influenced by differing data residency protocol and AI governance framework mandates.

For example, European regulations have led to a 20% higher adoption rate of energy-efficient liquid cooling to comply with strict environmental standards.

APAC's focus on custom silicon has spurred a significant rise in the deployment of application-specific integrated circuit and field-programmable gate array solutions, creating a distinct regional supply chain focused on localized machine learning operations and AI infrastructure-as-a-service.

What are the key Drivers, Trends, and Challenges in the Ai-specific Server Market?

Our researchers analyzed the data with 2025 as the base year, along with the key drivers, trends, and challenges. A holistic analysis of drivers will help companies refine their marketing strategies to gain a competitive advantage.

  • Enterprises evaluating GPU vs ASIC for AI workloads are navigating a complex decision matrix where performance-per-watt is a critical factor, with ASICs often delivering a 3x to 5x efficiency gain for specialized tasks. This trade-off is central to designing modern AI infrastructure, where managing AI server power consumption management is a primary operational challenge.
  • The implementation of advanced techniques, such as liquid cooling for high-density servers, has become standard practice, reducing energy costs by up to 30% and enabling the deployment of more powerful accelerators within existing data center footprints. Concurrently, the strategic imperative for data sovereignty is compelling organizations toward building a sovereign AI cloud.
  • This approach ensures compliance with data residency laws but introduces architectural complexity. Furthermore, as intelligence moves from the data center to the source of data generation, effective edge AI server deployment strategies are becoming crucial. These strategies prioritize low-latency processing and ruggedized hardware, ensuring reliable performance in diverse operational environments and balancing centralized training with distributed inference capabilities.

What are the key market drivers leading to the rise in the adoption of Ai-specific Server Industry?

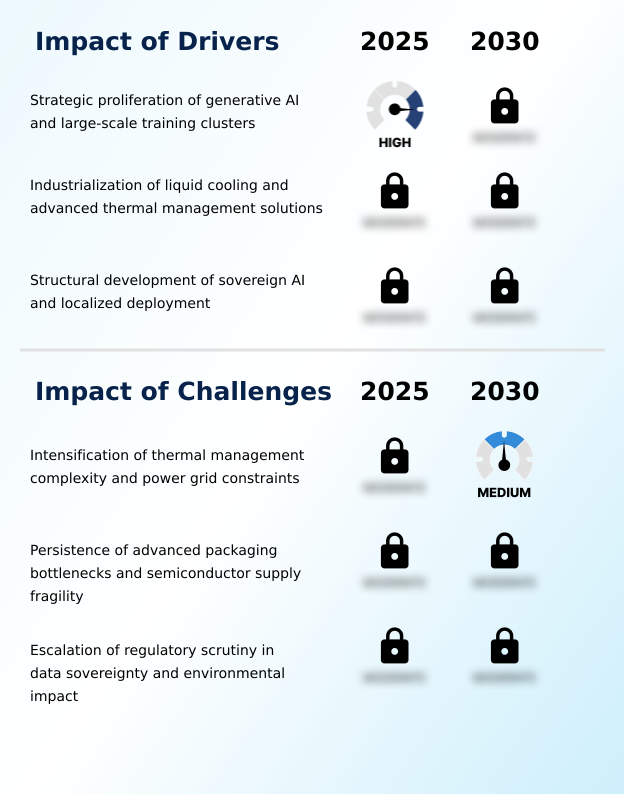
  • The strategic proliferation of generative AI and the industrialization of large-scale training clusters are primary drivers of market growth.

  • The strategic proliferation of generative AI workload requirements is a primary market driver, compelling enterprises to adopt GPU-accelerated computing solutions that can increase training efficiency by over 50%.
  • This industrialization of AI has accelerated demand for sovereign AI infrastructure, where data residency and security are paramount, particularly in regulated industries.
  • To manage the extreme heat from these systems, the adoption of direct-to-chip cooling has become standard, improving system uptime by reducing thermal throttling incidents by more than 90%.
  • The market is evolving toward an end-to-end data platform, supported by AI-driven orchestration that dynamically allocates resources for tasks like training an autonomous AI agent. This trend also encourages custom silicon development, leading to a more composable infrastructure.

What are the market trends shaping the Ai-specific Server Industry?

  • The institutionalization of 1.6-terabit ethernet and silicon photonics integration represents a key market trend. This shift is essential for eliminating bandwidth bottlenecks in large-scale AI training environments.

  • The institutionalization of 1.6-terabit ethernet is fundamentally reshaping high-density rack architecture, driven by the need to eliminate data throughput bottlenecks in large-scale training clusters, which can improve interconnect speed by up to 100% over prior standards.
  • This trend involves a structural shift from traditional pluggable modules to co-packaged optics, a key element of silicon photonics integration that reduces power consumption per bit by over 30%. The modern AI factory model increasingly relies on this optical-first approach to create a unified AI fabric essential for scaling generative AI.
  • This move toward integrated rack-scale design, often coupled with advanced liquid-cooling technology and high-performance interconnects, facilitates the deployment of massive compute capacity required for next-generation AI workloads.

What challenges does the Ai-specific Server Industry face during its growth?

  • The intensification of thermal management complexity and escalating power grid constraints pose a key challenge to industry growth.

  • A significant market challenge is the intensification of thermal management complexity, as the thermal design power (TDP) of accelerators has caused rack power requirements to exceed 120 kilowatts, a tenfold increase from legacy systems. This trend places severe strain on regional power grid constraint and degrades power usage effectiveness (PUE) metrics.
  • A concurrent challenge is the persistent advanced packaging bottleneck, particularly in chip-on-wafer-on-substrate (CoWoS) production, which can delay server shipments by six to nine months. This supply fragility complicates the AI model lifecycle, as hardware availability dictates development timelines.
  • While a modular data center and disaggregated server design offer some flexibility, these core power and semiconductor supply issues remain significant barriers to scalable deployment.

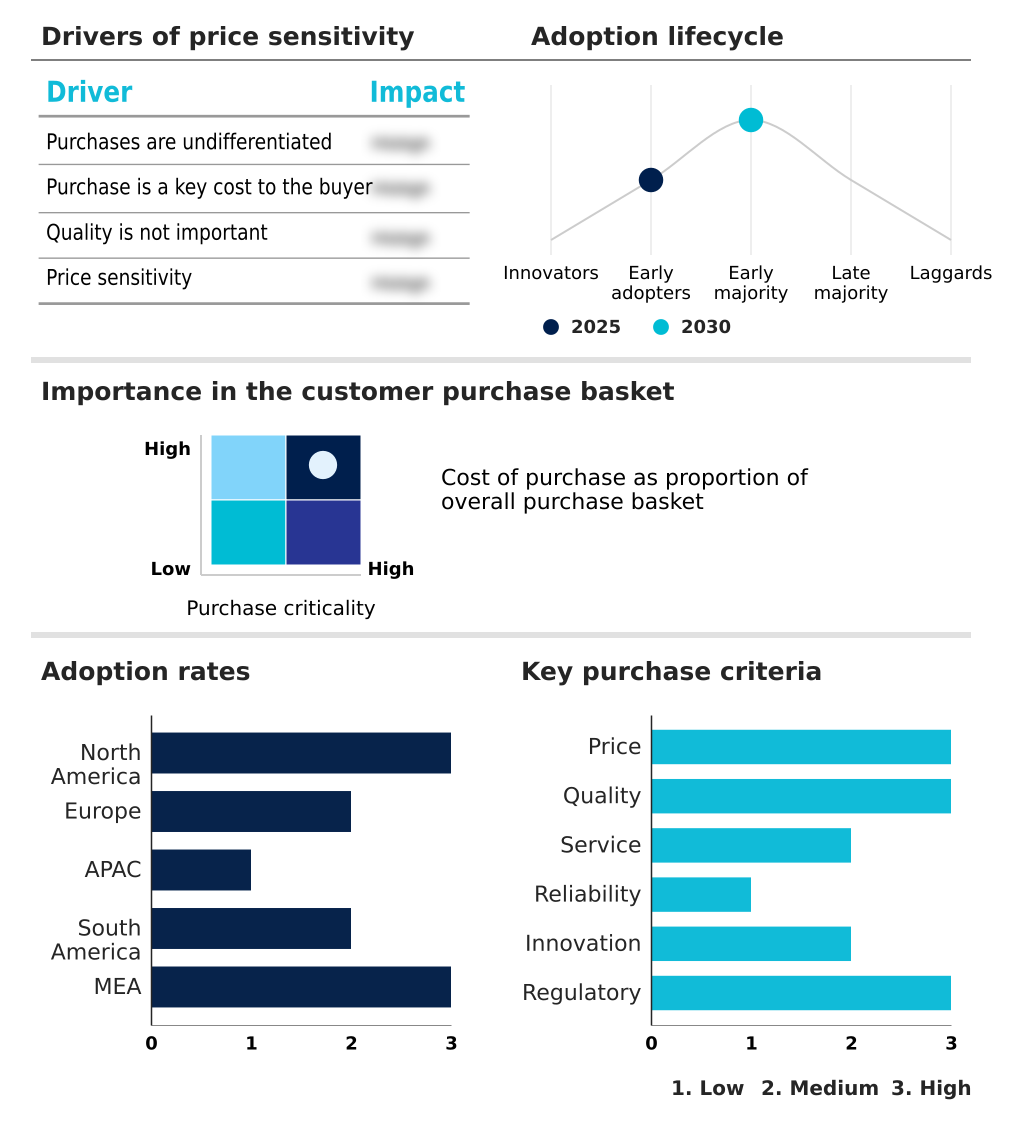
Exclusive Technavio Analysis on Customer Landscape

The ai-specific server market forecasting report includes the adoption lifecycle of the market, covering from the innovator’s stage to the laggard’s stage. It focuses on adoption rates in different regions based on penetration. Furthermore, the ai-specific server market report also includes key purchase criteria and drivers of price sensitivity to help companies evaluate and develop their market growth analysis strategies.

Customer Landscape of Ai-specific Server Industry

Competitive Landscape

Companies are implementing various strategies, such as strategic alliances, ai-specific server market forecast, partnerships, mergers and acquisitions, geographical expansion, and product/service launches, to enhance their presence in the industry.

Advanced Micro Devices Inc. - Vendors offer high-performance AI-specific servers featuring GPU acceleration, liquid cooling, and scalable architectures designed for end-to-end AI development and demanding workloads.

The industry research and growth report includes detailed analyses of the competitive landscape of the market and information about key companies, including:

  • Advanced Micro Devices Inc.
  • ASUSTeK Computer Inc.
  • Cerebras Systems Inc.
  • Cisco Systems Inc.
  • Dell Technologies Inc.
  • Gigabyte Technology Co. Ltd.
  • Hewlett Packard Enterprise Co.
  • IBM Corp.
  • Infineon Technologies AG
  • Intel Corp.
  • Inventec Corp.
  • Lenovo Group Ltd.
  • New H3C Technologies
  • NVIDIA Corp.
  • Penguin Solutions Inc.
  • Quanta Computer Inc.
  • Samsung Electronics Co. Ltd.
  • Super Micro Computer Inc.
  • Wiwynn Corp.

Qualitative and quantitative analysis of companies has been conducted to help clients understand the wider business environment as well as the strengths and weaknesses of key industry players. Data is qualitatively analyzed to categorize companies as pure play, category-focused, industry-focused, and diversified; it is quantitatively analyzed to categorize companies as dominant, leading, strong, tentative, and weak.

Market Intelligence Radar: High-Impact Developments & Growth Signals

  • In the Application Software industry, the increasing adoption of cloud-native and subscription-based software models is influencing the AI-specific server market by driving demand for elastic and scalable AI infrastructure-as-a-service platforms that can support on-demand computational workloads.
  • Growing data security and privacy concerns within the Application Software industry, particularly around cloud services, are accelerating the adoption of sovereign AI infrastructure and on-premises AI-specific servers that offer enhanced control and compliance with data residency protocols.
  • The proliferation of data and analytics tools within enterprise application software is creating a downstream requirement for powerful AI-specific servers, as businesses need robust hardware for machine learning operations and to process massive datasets for business intelligence and predictive modeling.
  • The rising automation of business processes through Application Software, such as RPA and BPM, is fueling demand for AI-specific servers capable of handling real-time inference workloads and supporting intelligent automation at scale within enterprise environments.

Dive into Technavio’s robust research methodology, blending expert interviews, extensive data synthesis, and validated models for unparalleled Ai-specific Server Market insights. See full methodology.

Market Scope
Page number 327
Base year 2025
Historic period 2020-2024
Forecast period 2026-2030
Growth momentum & CAGR Accelerate at a CAGR of 45.2%
Market growth 2026-2030 USD 769749.9 million
Market structure Fragmented
YoY growth 2025-2026(%) 18.1%
Key countries US, Canada, Mexico, Germany, UK, France, Italy, The Netherlands, Spain, China, Japan, India, South Korea, Australia, Indonesia, Brazil, Argentina, Chile, Saudi Arabia, UAE, South Africa, Israel and Turkey
Competitive landscape Leading Companies, Market Positioning of Companies, Competitive Strategies, and Industry Risks

Request Free Sample

Research Analyst Overview

  • The AI-specific server ecosystem is a highly interdependent value chain, with semiconductor designers providing over 85% of the core AI accelerators that define system performance. These components flow to original design manufacturers (ODMs) and original equipment manufacturers (OEMs), who assemble them into rack-scale systems.
  • These integrated systems are then procured by the primary end-users—hyperscale cloud providers and large enterprises—who now demand complete, pre-validated AI factory solutions rather than individual components. This shift has increased the importance of MLOps platforms and AI-driven orchestration software, which can improve resource utilization by up to 40%.
  • The entire ecosystem is shaped by the availability of critical technologies like high-bandwidth memory and advanced packaging, with supply bottlenecks directly impacting production timelines and market pricing.

What are the Key Data Covered in this Ai-specific Server Market Research and Growth Report?

  • What is the expected growth of the Ai-specific Server Market between 2026 and 2030?

    • The Ai-specific Server Market is expected to grow by USD 769.75 billion during 2026-2030, registering a CAGR of 45.2%. Year-over-year growth in 2026 is estimated at 18.1%%. This acceleration is shaped by strategic proliferation of generative ai and large-scale training clusters, which is intensifying demand across multiple end-use verticals covered in the report.

  • What segmentation does the market report cover?

    • The report is segmented by Processor Type (CPU-based, ASIC-based, GPU-based, and FPGA-based), Component (Hardware, Software, and Services), Deployment (On-premises, and Cloud), End-user (IT and telecom, Automotive, BFSI, Healthcare, and Others) and Geography (North America, Europe, APAC, South America, Middle East and Africa). Among these, the CPU-based segment is estimated to witness significant growth during the forecast period, driven by rising adoption across key application areas. Each segment includes detailed qualitative and quantitative analysis, along with historical data from 2020-2024 and forecasts through 2030 with year-over-year growth rates.

  • Which regions are analyzed in the report?

    • The report covers North America, Europe, APAC, South America and Middle East and Africa. North America is estimated to contribute 34.6% to market growth during the forecast period. Country-level analysis includes US, Canada, Mexico, Germany, UK, France, Italy, The Netherlands, Spain, China, Japan, India, South Korea, Australia, Indonesia, Brazil, Argentina, Chile, Saudi Arabia, UAE, South Africa, Israel and Turkey, with dedicated market size tables and year-over-year growth for each.

  • What are the key growth drivers and market challenges?

    • The primary driver is strategic proliferation of generative ai and large-scale training clusters, which is accelerating investment and industry demand. The main challenge is intensification of thermal management complexity and power grid constraints, creating operational barriers for key market participants. The report quantifies the impact of each driver and challenge across 2026 and 2030 with comparative analysis.

  • Who are the major players in the Ai-specific Server Market?

    • Key vendors include Advanced Micro Devices Inc., ASUSTeK Computer Inc., Cerebras Systems Inc., Cisco Systems Inc., Dell Technologies Inc., Gigabyte Technology Co. Ltd., Hewlett Packard Enterprise Co., IBM Corp., Infineon Technologies AG, Intel Corp., Inventec Corp., Lenovo Group Ltd., New H3C Technologies, NVIDIA Corp., Penguin Solutions Inc., Quanta Computer Inc., Samsung Electronics Co. Ltd., Super Micro Computer Inc. and Wiwynn Corp.. The report provides qualitative and quantitative analysis categorizing companies as dominant, leading, strong, tentative, and weak based on their market positioning. Company profiles include business segment analysis, SWOT assessment, key offerings, and recent strategic developments.

Market Research Insights

  • The competitive landscape for AI-specific servers is undergoing an accelerated consolidation around rack-scale solutions, with the top three vendors now commanding over 60% of the enterprise AI infrastructure segment. This market is shaped by a hyper-competitive innovation cycle where integrated systems are replacing standalone server sales.
  • Key vendors are launching turnkey AI Factory platforms that combine specialized silicon, high-speed networking, and modular data center infrastructure to reduce deployment times by half. These developments directly address enterprise demand for faster pilot-to-production timelines for generative AI. However, this progress is tempered by persistent supply chain bottlenecks for critical components like high-bandwidth memory.
  • In response, companies are diversifying their sourcing strategies and investing in long-term supply agreements to ensure production continuity and meet the surge in demand for sovereign AI-ready infrastructure.

We can help! Our analysts can customize this ai-specific server market research report to meet your requirements.

Get in touch

1. Executive Summary

1.1 Market overview

Executive Summary - Chart on Market Overview
Executive Summary - Data Table on Market Overview
Executive Summary - Chart on Global Market Characteristics
Executive Summary - Chart on Market by Geography
Executive Summary - Chart on Market Segmentation by Processor Type
Executive Summary - Chart on Market Segmentation by Component
Executive Summary - Chart on Market Segmentation by Deployment
Executive Summary - Chart on Market Segmentation by End-user
Executive Summary - Chart on Incremental Growth
Executive Summary - Data Table on Incremental Growth
Executive Summary - Chart on Company Market Positioning

2. Technavio Analysis

2.1 Analysis of price sensitivity, lifecycle, customer purchase basket, adoption rates, and purchase criteria

2.2 Criticality of inputs and Factors of differentiation

Chart on Overview on criticality of inputs and factors of differentiation

2.3 Factors of disruption

Chart on Overview on factors of disruption

2.4 Impact of drivers and challenges

Chart on Impact of drivers and challenges in 2025 and 2030

3. Market Landscape

3.1 Market ecosystem

Chart on Parent Market
Data Table on - Parent Market

3.2 Market characteristics

Chart on Market characteristics analysis

3.3 Value chain analysis

Chart on Value chain analysis

4. Market Sizing

4.1 Market definition

Data Table on Offerings of companies included in the market definition

4.2 Market segment analysis

Market segments

4.3 Market size 2025

4.4 Market outlook: Forecast for 2025-2030

Chart on Global - Market size and forecast 2025-2030 ($ million)
Data Table on Global - Market size and forecast 2025-2030 ($ million)
Chart on Global Market: Year-over-year growth 2025-2030 (%)
Data Table on Global Market: Year-over-year growth 2025-2030 (%)

5. Historic Market Size

5.1 Global AI-Specific Server Market 2020 - 2024

Historic Market Size - Data Table on Global AI-Specific Server Market 2020 - 2024 ($ million)

5.2 Processor Type segment analysis 2020 - 2024

Historic Market Size - Processor Type Segment 2020 - 2024 ($ million)

5.3 Component segment analysis 2020 - 2024

Historic Market Size - Component Segment 2020 - 2024 ($ million)

5.4 Deployment segment analysis 2020 - 2024

Historic Market Size - Deployment Segment 2020 - 2024 ($ million)

5.5 End-user segment analysis 2020 - 2024

Historic Market Size - End-user Segment 2020 - 2024 ($ million)

5.6 Geography segment analysis 2020 - 2024

Historic Market Size - Geography Segment 2020 - 2024 ($ million)

5.7 Country segment analysis 2020 - 2024

Historic Market Size - Country Segment 2020 - 2024 ($ million)

6. Qualitative Analysis

6.1 Impact of geopolitical conflict for global AI-specific server market

7. Five Forces Analysis

7.1 Five forces summary

Five forces analysis - Comparison between 2025 and 2030

7.2 Bargaining power of buyers

Bargaining power of buyers - Impact of key factors 2025 and 2030

7.3 Bargaining power of suppliers

Bargaining power of suppliers - Impact of key factors in 2025 and 2030

7.4 Threat of new entrants

Threat of new entrants - Impact of key factors in 2025 and 2030

7.5 Threat of substitutes

Threat of substitutes - Impact of key factors in 2025 and 2030

7.6 Threat of rivalry

Threat of rivalry - Impact of key factors in 2025 and 2030

7.7 Market condition

Chart on Market condition - Five forces 2025 and 2030

8. Market Segmentation by Processor Type

8.1 Market segments

Chart on Processor Type - Market share 2025-2030 (%)
Data Table on Processor Type - Market share 2025-2030 (%)

8.2 Comparison by Processor Type

Chart on Comparison by Processor Type
Data Table on Comparison by Processor Type

8.3 CPU-based - Market size and forecast 2025-2030

Chart on CPU-based - Market size and forecast 2025-2030 ($ million)
Data Table on CPU-based - Market size and forecast 2025-2030 ($ million)
Chart on CPU-based - Year-over-year growth 2025-2030 (%)
Data Table on CPU-based - Year-over-year growth 2025-2030 (%)

8.4 ASIC-based - Market size and forecast 2025-2030

Chart on ASIC-based - Market size and forecast 2025-2030 ($ million)
Data Table on ASIC-based - Market size and forecast 2025-2030 ($ million)
Chart on ASIC-based - Year-over-year growth 2025-2030 (%)
Data Table on ASIC-based - Year-over-year growth 2025-2030 (%)

8.5 GPU-based - Market size and forecast 2025-2030

Chart on GPU-based - Market size and forecast 2025-2030 ($ million)
Data Table on GPU-based - Market size and forecast 2025-2030 ($ million)
Chart on GPU-based - Year-over-year growth 2025-2030 (%)
Data Table on GPU-based - Year-over-year growth 2025-2030 (%)

8.6 FPGA-based - Market size and forecast 2025-2030

Chart on FPGA-based - Market size and forecast 2025-2030 ($ million)
Data Table on FPGA-based - Market size and forecast 2025-2030 ($ million)
Chart on FPGA-based - Year-over-year growth 2025-2030 (%)
Data Table on FPGA-based - Year-over-year growth 2025-2030 (%)

8.7 Market opportunity by Processor Type

Market opportunity by Processor Type ($ million)
Data Table on Market opportunity by Processor Type ($ million)

9. Market Segmentation by Component

9.1 Market segments

Chart on Component - Market share 2025-2030 (%)
Data Table on Component - Market share 2025-2030 (%)

9.2 Comparison by Component

Chart on Comparison by Component
Data Table on Comparison by Component

9.3 Hardware - Market size and forecast 2025-2030

Chart on Hardware - Market size and forecast 2025-2030 ($ million)
Data Table on Hardware - Market size and forecast 2025-2030 ($ million)
Chart on Hardware - Year-over-year growth 2025-2030 (%)
Data Table on Hardware - Year-over-year growth 2025-2030 (%)

9.4 Software - Market size and forecast 2025-2030

Chart on Software - Market size and forecast 2025-2030 ($ million)
Data Table on Software - Market size and forecast 2025-2030 ($ million)
Chart on Software - Year-over-year growth 2025-2030 (%)
Data Table on Software - Year-over-year growth 2025-2030 (%)

9.5 Services - Market size and forecast 2025-2030

Chart on Services - Market size and forecast 2025-2030 ($ million)
Data Table on Services - Market size and forecast 2025-2030 ($ million)
Chart on Services - Year-over-year growth 2025-2030 (%)
Data Table on Services - Year-over-year growth 2025-2030 (%)

9.6 Market opportunity by Component

Market opportunity by Component ($ million)
Data Table on Market opportunity by Component ($ million)

10. Market Segmentation by Deployment

10.1 Market segments

Chart on Deployment - Market share 2025-2030 (%)
Data Table on Deployment - Market share 2025-2030 (%)

10.2 Comparison by Deployment

Chart on Comparison by Deployment
Data Table on Comparison by Deployment

10.3 On-premises - Market size and forecast 2025-2030

Chart on On-premises - Market size and forecast 2025-2030 ($ million)
Data Table on On-premises - Market size and forecast 2025-2030 ($ million)
Chart on On-premises - Year-over-year growth 2025-2030 (%)
Data Table on On-premises - Year-over-year growth 2025-2030 (%)

10.4 Cloud - Market size and forecast 2025-2030

Chart on Cloud - Market size and forecast 2025-2030 ($ million)
Data Table on Cloud - Market size and forecast 2025-2030 ($ million)
Chart on Cloud - Year-over-year growth 2025-2030 (%)
Data Table on Cloud - Year-over-year growth 2025-2030 (%)

10.5 Market opportunity by Deployment

Market opportunity by Deployment ($ million)
Data Table on Market opportunity by Deployment ($ million)

11. Market Segmentation by End-user

11.1 Market segments

Chart on End-user - Market share 2025-2030 (%)
Data Table on End-user - Market share 2025-2030 (%)

11.2 Comparison by End-user

Chart on Comparison by End-user
Data Table on Comparison by End-user

11.3 IT and telecom - Market size and forecast 2025-2030

Chart on IT and telecom - Market size and forecast 2025-2030 ($ million)
Data Table on IT and telecom - Market size and forecast 2025-2030 ($ million)
Chart on IT and telecom - Year-over-year growth 2025-2030 (%)
Data Table on IT and telecom - Year-over-year growth 2025-2030 (%)

11.4 Automotive - Market size and forecast 2025-2030

Chart on Automotive - Market size and forecast 2025-2030 ($ million)
Data Table on Automotive - Market size and forecast 2025-2030 ($ million)
Chart on Automotive - Year-over-year growth 2025-2030 (%)
Data Table on Automotive - Year-over-year growth 2025-2030 (%)

11.5 BFSI - Market size and forecast 2025-2030

Chart on BFSI - Market size and forecast 2025-2030 ($ million)
Data Table on BFSI - Market size and forecast 2025-2030 ($ million)
Chart on BFSI - Year-over-year growth 2025-2030 (%)
Data Table on BFSI - Year-over-year growth 2025-2030 (%)

11.6 Healthcare - Market size and forecast 2025-2030

Chart on Healthcare - Market size and forecast 2025-2030 ($ million)
Data Table on Healthcare - Market size and forecast 2025-2030 ($ million)
Chart on Healthcare - Year-over-year growth 2025-2030 (%)
Data Table on Healthcare - Year-over-year growth 2025-2030 (%)

11.7 Others - Market size and forecast 2025-2030

Chart on Others - Market size and forecast 2025-2030 ($ million)
Data Table on Others - Market size and forecast 2025-2030 ($ million)
Chart on Others - Year-over-year growth 2025-2030 (%)
Data Table on Others - Year-over-year growth 2025-2030 (%)

11.8 Market opportunity by End-user

Market opportunity by End-user ($ million)
Data Table on Market opportunity by End-user ($ million)

12. Customer Landscape

12.1 Customer landscape overview

Analysis of price sensitivity, lifecycle, customer purchase basket, adoption rates, and purchase criteria

13. Geographic Landscape

13.1 Geographic segmentation

Chart on Market share by geography 2025-2030 (%)
Data Table on Market share by geography 2025-2030 (%)

13.2 Geographic comparison

Chart on Geographic comparison
Data Table on Geographic comparison

13.3 North America - Market size and forecast 2025-2030

Chart on North America - Market size and forecast 2025-2030 ($ million)
Data Table on North America - Market size and forecast 2025-2030 ($ million)
Chart on North America - Year-over-year growth 2025-2030 (%)
Data Table on North America - Year-over-year growth 2025-2030 (%)
Chart on Regional Comparison - North America
Data Table on Regional Comparison - North America

13.3.1 US - Market size and forecast 2025-2030

Chart on US - Market size and forecast 2025-2030 ($ million)
Data Table on US - Market size and forecast 2025-2030 ($ million)
Chart on US - Year-over-year growth 2025-2030 (%)
Data Table on US - Year-over-year growth 2025-2030 (%)

13.3.2 Canada - Market size and forecast 2025-2030

Chart on Canada - Market size and forecast 2025-2030 ($ million)
Data Table on Canada - Market size and forecast 2025-2030 ($ million)
Chart on Canada - Year-over-year growth 2025-2030 (%)
Data Table on Canada - Year-over-year growth 2025-2030 (%)

13.3.3 Mexico - Market size and forecast 2025-2030

Chart on Mexico - Market size and forecast 2025-2030 ($ million)
Data Table on Mexico - Market size and forecast 2025-2030 ($ million)
Chart on Mexico - Year-over-year growth 2025-2030 (%)
Data Table on Mexico - Year-over-year growth 2025-2030 (%)

13.4 Europe - Market size and forecast 2025-2030

Chart on Europe - Market size and forecast 2025-2030 ($ million)
Data Table on Europe - Market size and forecast 2025-2030 ($ million)
Chart on Europe - Year-over-year growth 2025-2030 (%)
Data Table on Europe - Year-over-year growth 2025-2030 (%)
Chart on Regional Comparison - Europe
Data Table on Regional Comparison - Europe

13.4.1 Germany - Market size and forecast 2025-2030

Chart on Germany - Market size and forecast 2025-2030 ($ million)
Data Table on Germany - Market size and forecast 2025-2030 ($ million)
Chart on Germany - Year-over-year growth 2025-2030 (%)
Data Table on Germany - Year-over-year growth 2025-2030 (%)

13.4.2 UK - Market size and forecast 2025-2030

Chart on UK - Market size and forecast 2025-2030 ($ million)
Data Table on UK - Market size and forecast 2025-2030 ($ million)
Chart on UK - Year-over-year growth 2025-2030 (%)
Data Table on UK - Year-over-year growth 2025-2030 (%)

13.4.3 France - Market size and forecast 2025-2030

Chart on France - Market size and forecast 2025-2030 ($ million)
Data Table on France - Market size and forecast 2025-2030 ($ million)
Chart on France - Year-over-year growth 2025-2030 (%)
Data Table on France - Year-over-year growth 2025-2030 (%)

13.4.4 Italy - Market size and forecast 2025-2030

Chart on Italy - Market size and forecast 2025-2030 ($ million)
Data Table on Italy - Market size and forecast 2025-2030 ($ million)
Chart on Italy - Year-over-year growth 2025-2030 (%)
Data Table on Italy - Year-over-year growth 2025-2030 (%)

13.4.5 The Netherlands - Market size and forecast 2025-2030

Chart on The Netherlands - Market size and forecast 2025-2030 ($ million)
Data Table on The Netherlands - Market size and forecast 2025-2030 ($ million)
Chart on The Netherlands - Year-over-year growth 2025-2030 (%)
Data Table on The Netherlands - Year-over-year growth 2025-2030 (%)

13.4.6 Spain - Market size and forecast 2025-2030

Chart on Spain - Market size and forecast 2025-2030 ($ million)
Data Table on Spain - Market size and forecast 2025-2030 ($ million)
Chart on Spain - Year-over-year growth 2025-2030 (%)
Data Table on Spain - Year-over-year growth 2025-2030 (%)

13.5 APAC - Market size and forecast 2025-2030

Chart on APAC - Market size and forecast 2025-2030 ($ million)
Data Table on APAC - Market size and forecast 2025-2030 ($ million)
Chart on APAC - Year-over-year growth 2025-2030 (%)
Data Table on APAC - Year-over-year growth 2025-2030 (%)
Chart on Regional Comparison - APAC
Data Table on Regional Comparison - APAC

13.5.1 China - Market size and forecast 2025-2030

Chart on China - Market size and forecast 2025-2030 ($ million)
Data Table on China - Market size and forecast 2025-2030 ($ million)
Chart on China - Year-over-year growth 2025-2030 (%)
Data Table on China - Year-over-year growth 2025-2030 (%)

13.5.2 Japan - Market size and forecast 2025-2030

Chart on Japan - Market size and forecast 2025-2030 ($ million)
Data Table on Japan - Market size and forecast 2025-2030 ($ million)
Chart on Japan - Year-over-year growth 2025-2030 (%)
Data Table on Japan - Year-over-year growth 2025-2030 (%)

13.5.3 India - Market size and forecast 2025-2030

Chart on India - Market size and forecast 2025-2030 ($ million)
Data Table on India - Market size and forecast 2025-2030 ($ million)
Chart on India - Year-over-year growth 2025-2030 (%)
Data Table on India - Year-over-year growth 2025-2030 (%)

13.5.4 South Korea - Market size and forecast 2025-2030

Chart on South Korea - Market size and forecast 2025-2030 ($ million)
Data Table on South Korea - Market size and forecast 2025-2030 ($ million)
Chart on South Korea - Year-over-year growth 2025-2030 (%)
Data Table on South Korea - Year-over-year growth 2025-2030 (%)

13.5.5 Australia - Market size and forecast 2025-2030

Chart on Australia - Market size and forecast 2025-2030 ($ million)
Data Table on Australia - Market size and forecast 2025-2030 ($ million)
Chart on Australia - Year-over-year growth 2025-2030 (%)
Data Table on Australia - Year-over-year growth 2025-2030 (%)

13.5.6 Indonesia - Market size and forecast 2025-2030

Chart on Indonesia - Market size and forecast 2025-2030 ($ million)
Data Table on Indonesia - Market size and forecast 2025-2030 ($ million)
Chart on Indonesia - Year-over-year growth 2025-2030 (%)
Data Table on Indonesia - Year-over-year growth 2025-2030 (%)

13.6 South America - Market size and forecast 2025-2030

Chart on South America - Market size and forecast 2025-2030 ($ million)
Data Table on South America - Market size and forecast 2025-2030 ($ million)
Chart on South America - Year-over-year growth 2025-2030 (%)
Data Table on South America - Year-over-year growth 2025-2030 (%)
Chart on Regional Comparison - South America
Data Table on Regional Comparison - South America

13.6.1 Brazil - Market size and forecast 2025-2030

Chart on Brazil - Market size and forecast 2025-2030 ($ million)
Data Table on Brazil - Market size and forecast 2025-2030 ($ million)
Chart on Brazil - Year-over-year growth 2025-2030 (%)
Data Table on Brazil - Year-over-year growth 2025-2030 (%)

13.6.2 Argentina - Market size and forecast 2025-2030

Chart on Argentina - Market size and forecast 2025-2030 ($ million)
Data Table on Argentina - Market size and forecast 2025-2030 ($ million)
Chart on Argentina - Year-over-year growth 2025-2030 (%)
Data Table on Argentina - Year-over-year growth 2025-2030 (%)

13.6.3 Chile - Market size and forecast 2025-2030

Chart on Chile - Market size and forecast 2025-2030 ($ million)
Data Table on Chile - Market size and forecast 2025-2030 ($ million)
Chart on Chile - Year-over-year growth 2025-2030 (%)
Data Table on Chile - Year-over-year growth 2025-2030 (%)

13.7 Middle East and Africa - Market size and forecast 2025-2030

Chart on Middle East and Africa - Market size and forecast 2025-2030 ($ million)
Data Table on Middle East and Africa - Market size and forecast 2025-2030 ($ million)
Chart on Middle East and Africa - Year-over-year growth 2025-2030 (%)
Data Table on Middle East and Africa - Year-over-year growth 2025-2030 (%)
Chart on Regional Comparison - Middle East and Africa
Data Table on Regional Comparison - Middle East and Africa

13.7.1 Saudi Arabia - Market size and forecast 2025-2030

Chart on Saudi Arabia - Market size and forecast 2025-2030 ($ million)
Data Table on Saudi Arabia - Market size and forecast 2025-2030 ($ million)
Chart on Saudi Arabia - Year-over-year growth 2025-2030 (%)
Data Table on Saudi Arabia - Year-over-year growth 2025-2030 (%)

13.7.2 UAE - Market size and forecast 2025-2030

Chart on UAE - Market size and forecast 2025-2030 ($ million)
Data Table on UAE - Market size and forecast 2025-2030 ($ million)
Chart on UAE - Year-over-year growth 2025-2030 (%)
Data Table on UAE - Year-over-year growth 2025-2030 (%)

13.7.3 South Africa - Market size and forecast 2025-2030

Chart on South Africa - Market size and forecast 2025-2030 ($ million)
Data Table on South Africa - Market size and forecast 2025-2030 ($ million)
Chart on South Africa - Year-over-year growth 2025-2030 (%)
Data Table on South Africa - Year-over-year growth 2025-2030 (%)

13.7.4 Israel - Market size and forecast 2025-2030

Chart on Israel - Market size and forecast 2025-2030 ($ million)
Data Table on Israel - Market size and forecast 2025-2030 ($ million)
Chart on Israel - Year-over-year growth 2025-2030 (%)
Data Table on Israel - Year-over-year growth 2025-2030 (%)

13.7.5 Turkey - Market size and forecast 2025-2030

Chart on Turkey - Market size and forecast 2025-2030 ($ million)
Data Table on Turkey - Market size and forecast 2025-2030 ($ million)
Chart on Turkey - Year-over-year growth 2025-2030 (%)
Data Table on Turkey - Year-over-year growth 2025-2030 (%)

13.8 Market opportunity by geography

Market opportunity by geography ($ million)
Data Tables on Market opportunity by geography ($ million)

14. Drivers, Challenges, and Opportunity

14.1 Market drivers

Strategic proliferation of generative AI and large-scale training clusters
Industrialization of liquid cooling and advanced thermal management solutions
Structural development of sovereign AI and localized deployment

14.2 Market challenges

Intensification of thermal management complexity and power grid constraints
Persistence of advanced packaging bottlenecks and semiconductor supply fragility
Escalation of regulatory scrutiny in data sovereignty and environmental impact

14.3 Impact of drivers and challenges

Impact of drivers and challenges in 2025 and 2030

14.4 Market opportunities

Institutionalization of 1.6-Terabit ethernet and silicon photonics integration
Proliferation of high-density modular power and prefabricated rack architectures
Strategic expansion of sovereign AI clusters and custom ASIC infrastructure

15. Competitive Landscape

15.1 Overview

15.2

Overview on criticality of inputs and factors of differentiation

15.3 Landscape disruption

Overview on factors of disruption

15.4 Industry risks

Impact of key risks on business

16. Competitive Analysis

16.1 Companies profiled

Companies covered

16.2 Company ranking index

16.3 Market positioning of companies

Matrix on companies position and classification

16.4 Advanced Micro Devices Inc.

Advanced Micro Devices Inc. - Overview
Advanced Micro Devices Inc. - Business segments
Advanced Micro Devices Inc. - Key news
Advanced Micro Devices Inc. - Key offerings
Advanced Micro Devices Inc. - Segment focus
SWOT

16.5 ASUSTeK Computer Inc.

ASUSTeK Computer Inc. - Overview
ASUSTeK Computer Inc. - Business segments
ASUSTeK Computer Inc. - Key offerings
ASUSTeK Computer Inc. - Segment focus
SWOT

16.6 Cisco Systems Inc.

Cisco Systems Inc. - Overview
Cisco Systems Inc. - Business segments
Cisco Systems Inc. - Key news
Cisco Systems Inc. - Key offerings
Cisco Systems Inc. - Segment focus
SWOT

16.7 Dell Technologies Inc.

Dell Technologies Inc. - Overview
Dell Technologies Inc. - Business segments
Dell Technologies Inc. - Key news
Dell Technologies Inc. - Key offerings
Dell Technologies Inc. - Segment focus
SWOT

16.8 Hewlett Packard Enterprise Co.

Hewlett Packard Enterprise Co. - Overview
Hewlett Packard Enterprise Co. - Business segments
Hewlett Packard Enterprise Co. - Key news
Hewlett Packard Enterprise Co. - Key offerings
Hewlett Packard Enterprise Co. - Segment focus
SWOT

16.9 IBM Corp.

IBM Corp. - Overview
IBM Corp. - Business segments
IBM Corp. - Key news
IBM Corp. - Key offerings
IBM Corp. - Segment focus
SWOT

16.10 Infineon Technologies AG

Infineon Technologies AG - Overview
Infineon Technologies AG - Business segments
Infineon Technologies AG - Key news
Infineon Technologies AG - Key offerings
Infineon Technologies AG - Segment focus
SWOT

16.11 Intel Corp.

Intel Corp. - Overview
Intel Corp. - Business segments
Intel Corp. - Key news
Intel Corp. - Key offerings
Intel Corp. - Segment focus
SWOT

16.12 Lenovo Group Ltd.

Lenovo Group Ltd. - Overview
Lenovo Group Ltd. - Business segments
Lenovo Group Ltd. - Key offerings
Lenovo Group Ltd. - Segment focus
SWOT

16.13 NVIDIA Corp.

NVIDIA Corp. - Overview
NVIDIA Corp. - Business segments
NVIDIA Corp. - Key news
NVIDIA Corp. - Key offerings
NVIDIA Corp. - Segment focus
SWOT

16.14 Penguin Solutions Inc.

Penguin Solutions Inc. - Overview
Penguin Solutions Inc. - Business segments
Penguin Solutions Inc. - Key news
Penguin Solutions Inc. - Key offerings
Penguin Solutions Inc. - Segment focus
SWOT

16.15 Quanta Computer Inc.

Quanta Computer Inc. - Overview
Quanta Computer Inc. - Business segments
Quanta Computer Inc. - Key offerings
Quanta Computer Inc. - Segment focus
SWOT

16.16 Samsung Electronics Co. Ltd.

Samsung Electronics Co. Ltd. - Overview
Samsung Electronics Co. Ltd. - Business segments
Samsung Electronics Co. Ltd. - Key news
Samsung Electronics Co. Ltd. - Key offerings
Samsung Electronics Co. Ltd. - Segment focus
SWOT

16.17 Super Micro Computer Inc.

Super Micro Computer Inc. - Overview
Super Micro Computer Inc. - Business segments
Super Micro Computer Inc. - Key offerings
Super Micro Computer Inc. - Segment focus
SWOT

16.18 Wiwynn Corp.

Wiwynn Corp. - Overview
Wiwynn Corp. - Product / Service
Wiwynn Corp. - Key offerings
SWOT

17. Appendix

17.1 Scope of the report

Market definition
Objectives
Notes and caveats

17.2 Inclusions and exclusions checklist

Inclusions checklist
Exclusions checklist

17.3 Currency conversion rates for US$

17.4 Research methodology

17.5 Data procurement

Information sources

17.6 Data validation

17.7 Validation techniques employed for market sizing

17.8 Data synthesis

17.9 360 degree market analysis

17.10 List of abbreviations

Research Methodology

Technavio presents a detailed picture of the market by way of study, synthesis, and summation of data from multiple sources. The analysts have presented the various facets of the market with a particular focus on identifying the key industry influencers. The data thus presented is comprehensive, reliable, and the result of extensive research, both primary and secondary.

INFORMATION SOURCES

Primary sources

  • Manufacturers and suppliers
  • Channel partners
  • Industry experts
  • Strategic decision makers

Secondary sources

  • Industry journals and periodicals
  • Government data
  • Financial reports of key industry players
  • Historical data
  • Press releases

DATA ANALYSIS

Data Synthesis

  • Collation of data
  • Estimation of key figures
  • Analysis of derived insights

Data Validation

  • Triangulation with data models
  • Reference against proprietary databases
  • Corroboration with industry experts

REPORT WRITING

Qualitative

  • Market drivers
  • Market challenges
  • Market trends
  • Five forces analysis

Quantitative

  • Market size and forecast
  • Market segmentation
  • Geographical insights
  • Competitive landscape

Interested in this report?

Get your sample now to see our research methodology and insights!

Download Now

Frequently Asked Questions

Ai-specific Server market growth will increase by USD 769749.9 million during 2026-2030.

The Ai-specific Server market is expected to grow at a CAGR of 45.2% during 2026-2030.

Ai-specific Server market is segmented by Processor type (CPU-based, ASIC-based, GPU-based, FPGA-based) Component (Hardware, Software, Services) Deployment (On-premises, Cloud) End-user (IT and telecom, Automotive, BFSI, Healthcare, Others)

Advanced Micro Devices Inc., ASUSTeK Computer Inc., Cerebras Systems Inc., Cisco Systems Inc., Dell Technologies Inc., Gigabyte Technology Co. Ltd., Hewlett Packard Enterprise Co., IBM Corp., Infineon Technologies AG, Intel Corp., Inventec Corp., Lenovo Group Ltd., New H3C Technologies, NVIDIA Corp., Penguin Solutions Inc., Quanta Computer Inc., Samsung Electronics Co. Ltd., Super Micro Computer Inc., Wiwynn Corp. are a few of the key vendors in the Ai-specific Server market.

North America will register the highest growth rate of 34.6% among the other regions. Therefore, the Ai-specific Server market in North America is expected to garner significant business opportunities for the vendors during the forecast period.

US, Canada, Mexico, Germany, UK, France, Italy, The Netherlands, Spain, China, Japan, India, South Korea, Australia, Indonesia, Brazil, Argentina, Chile, Saudi Arabia, UAE, South Africa, Israel, Turkey

  • Strategic proliferation of generative AI and large-scale training clusters is the driving factor this market.

The Ai-specific Server market vendors should focus on grabbing business opportunities from the Processor type segment as it accounted for the largest market share in the base year.
RIA - Research AI Assistant
Ask RIA