AI Inference Optimization Software Market Analysis, Size, and Forecast 2026-2030: North America (US, Canada, and Mexico), Europe (Germany, UK, and France), APAC (China, Japan, and India), South America (Brazil, Argentina, and Colombia), Middle East and Africa (Saudi Arabia, UAE, and South Africa), and Rest of World (ROW)

AI Inference Optimization Software Market Analysis, Size, and Forecast 2026-2030:
North America (US, Canada, and Mexico), Europe (Germany, UK, and France), APAC (China, Japan, and India), South America (Brazil, Argentina, and Colombia), Middle East and Africa (Saudi Arabia, UAE, and South Africa), and Rest of World (ROW)

Published: May 2026 299 Pages SKU: IRTNTR81290

Market Overview at a Glance

$3.72 B
Market Opportunity
22.1%
CAGR 2025 - 2030
39.6%
North America Growth
$582.4 Mn
Model optimization tools segment 2024

Ai Inference Optimization Software Market Size and Growth Forecast 2026-2030

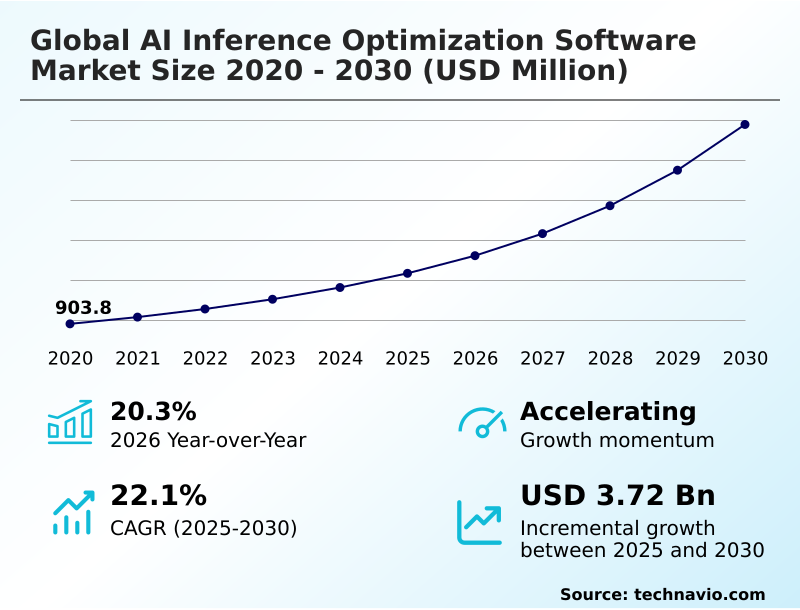
The Ai Inference Optimization Software Market size was valued at USD 2.17 billion in 2025 growing at a CAGR of 22.1% during the forecast period 2026-2030.

North America accounts for 39.6% of incremental growth during the forecast period. The Model optimization tools segment by Component was valued at USD 582.4 million in 2024, while the Cloud based segment holds the largest revenue share by Deployment.

The market is projected to grow by USD 4.98 billion from 2020 to 2030, with USD 3.72 billion of the growth expected during the forecast period of 2025 to 2030.

Get Key Insights on Market Forecast (PDF) Request Free Sample

Ai Inference Optimization Software Market Overview

The AI inference optimization software market is defined by the imperative to bridge the gap between large, computationally-intensive neural networks and the practical constraints of production environments. Growth is driven by the need for efficient ai in data centers and on resource-limited hardware, with North America accounting for nearly 40% of the incremental growth. Core to this is managing generative ai deployment costs and enabling ai inference on cpu. For instance, a smart factory implementing real-time computer vision for quality control on a production line uses optimization software for ai workload orchestration, deploying pruned models on embedded ai systems to detect defects without cloud latency. This on-premise ai inference capability, governed by standards like the Open Neural Network Exchange (ONNX) for interoperability, is crucial for improving inference server throughput and operational efficiency, directly impacting manufacturing yields and reducing waste.

Drivers, Trends, and Challenges in the Ai Inference Optimization Software Market

Strategic decision-making in the global AI inference optimization software market is increasingly influenced by the dual pressures of performance requirements and regulatory compliance. The challenge of deploying large language models on edge devices necessitates advanced software tools for optimizing generative ai, moving beyond brute-force hardware scaling.

For instance, an automotive OEM in the EU, navigating the stringent requirements of the upcoming EU AI Act, must use quantization-aware training for accuracy preservation in its advanced driver-assistance systems to ensure safety-critical reliability.

This involves a detailed cost-benefit analysis of on-premise vs cloud ai inference, where on-device processing can reduce latency by more than 50% compared to a round trip to a distant cloud server, a critical factor for real-time decision-making.

The performance comparison of ai inference runtimes becomes a key part of vendor qualification, with a focus on cross-platform deployment using onnx runtime to mitigate the impact of hardware heterogeneity on ai performance and avoid vendor lock-in. These best practices for ai model optimization are fundamental to reducing tco for large-scale ai deployment and ensuring long-term viability.

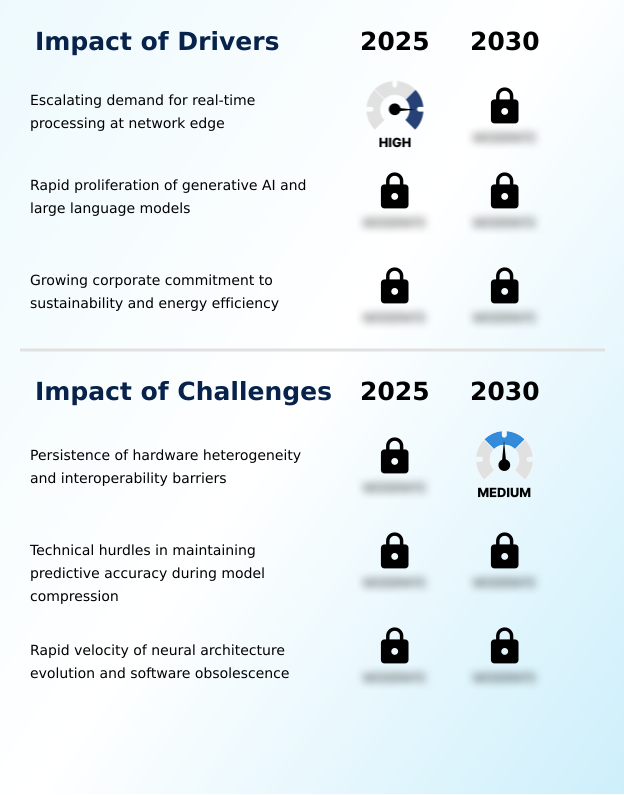
Primary Growth Driver: The escalating demand for real-time data processing at the network edge, driven by latency-sensitive applications in autonomous systems and IoT, serves as a primary catalyst for the market.

The market's momentum is fueled by the escalating demand for real-time ai processing at the network edge and the explosive growth of generative AI.

Enterprises are driven to adopt optimization software to manage generative ai deployment costs, which can be prohibitive at scale. This has intensified the focus on techniques that enable low-latency llm serving and efficient on-device machine learning.

In practice, deploying ai for industrial iot applications, such as predictive maintenance sensors in a factory, requires models optimized for minimal power consumption and memory footprint.

This need is amplified by corporate sustainability goals, pushing organizations to adopt energy-efficient neural networks to reduce their overall carbon footprint, a consideration now integral to IT procurement and strategy.

Emerging Market Trend: The proliferation of hardware-agnostic compilation and interoperability standards is reshaping model deployment strategies, enabling performance optimization across diverse silicon architectures without vendor lock-in.

A defining trend is the move toward hardware-agnostic compilation, which decouples model development from specific silicon, a significant factor in a market exhibiting a year-over-year growth of 20.3%. This allows for seamless cross-platform ml deployment using a unified hardware abstraction layer for ai.

Enterprises are leveraging advanced tools like the Multi-Level Intermediate Representation (MLIR) as a common compiler for deep learning, enabling a single optimized model to be deployed across diverse hardware environments. This approach is critical for firms adopting multi-cloud strategies, as it ensures consistent performance and simplifies the management of ai model serving frameworks.

The focus has shifted from hardware-specific tuning to creating portable, high-performance artifacts that can run anywhere from data centers to the edge.

Key Industry Challenge: The persistence of hardware heterogeneity and interoperability barriers creates significant engineering challenges, hindering the development of universally efficient and portable AI solutions across the industry.

A primary market challenge stems from the persistence of hardware heterogeneity, which complicates deployment and increases total cost of ownership. The lack of a universal hardware abstraction layer for ai means that optimization software must support a fragmented ecosystem of processors, from CPUs and GPUs to specialized AI accelerators.

This issue is particularly acute when dealing with the challenges in optimizing sparse neural networks, which have different computational patterns than dense models. As a result, engineering teams must use a variety of software tools for optimizing generative ai, often creating bespoke solutions for each deployment target.

This fragmentation, underscored by initiatives like the Unified Acceleration Foundation seeking to improve portability, remains a significant barrier to achieving a truly unified and efficient AI development lifecycle.

Explore Full Market Dynamics Analysis Request Free Sample

Ai Inference Optimization Software Market Segmentation

The ai inference optimization software industry research report provides comprehensive data including region-wise segment analysis, with forecasts and analysis for the period 2026-2030, as well as historical data from 2020-2024 for the following segments.

Market Segment by Component
  • Model optimization tools
  • Inference runtimes and engines
  • Platforms and frameworks
  • Services
Market Segment by Deployment
  • Cloud based
  • On premises
Market Segment by Business segment
  • Large enterprises
  • Small and medium enterprises
Market Segment by Geography
North America
US, Canada, Mexico
Europe
Germany, UK, France, Italy, The Netherlands, Spain
APAC
China, Japan, India, South Korea, Australia, Indonesia
South America
Brazil, Argentina, Colombia
Middle East and Africa
Saudi Arabia, UAE, South Africa, Israel, Turkey

Component Segment Analysis

The model optimization tools segment is estimated to witness significant growth during the forecast period.

Model optimization tools represent a foundational market segment, addressing the critical need to adapt complex neural networks for operational deployment.

Procurement decisions in this area focus on techniques like model quantization and neural network pruning to reduce computational and memory footprints.

These tools are essential for managing the inherent latency vs accuracy tradeoff, enabling ai model deployment on diverse hardware, from data centers to edge devices.

Within an enterprise setting, a data science team at a financial services firm might use knowledge distillation to create a low-latency fraud detection model from a larger, more complex parent, ensuring real-time transaction analysis without prohibitive hardware costs.

This segment's activity, which accounts for a significant portion of the market, underscores the shift from model training to efficient, scalable inference.

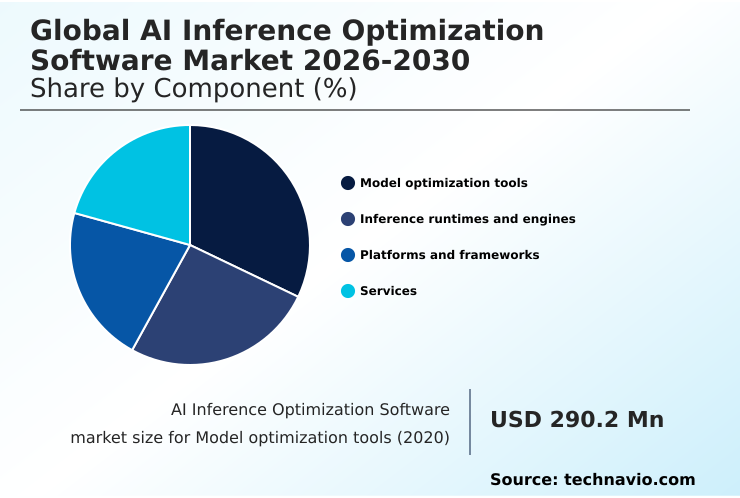
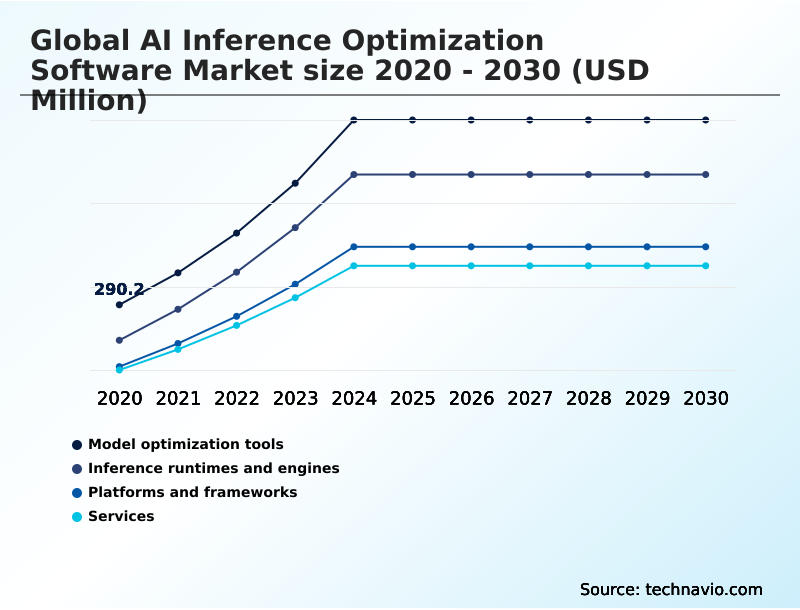
The Model optimization tools segment was valued at USD 582.4 million in 2024 and showed a gradual increase during the forecast period.

Ai Inference Optimization Software Market by Region: North America Leads with 39.6% Growth Share

North America is estimated to contribute 39.6% to the growth of the global market during the forecast period.

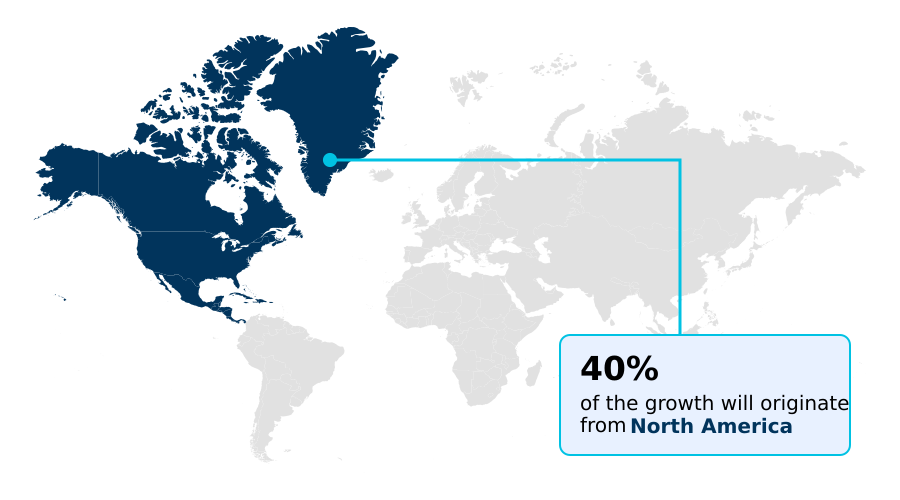
The geographic landscape is led by North America, which is forecast to contribute approximately 39.6% of the market's growth, driven by its dense concentration of hyperscale data centers and AI research hubs.

In this region, optimizing transformer models for applications in finance and healthcare is a primary focus. Europe follows, with an emphasis on industrial applications and adherence to the EU AI Act, promoting investment in on-premise ai inference solutions.

Meanwhile, APAC is the fastest-growing region, with a significant demand for on-device machine learning and mobile ai performance to serve its vast consumer base.

In a typical use case, an automotive manufacturer in Germany deploys optimized models for ai in autonomous systems, leveraging federated learning optimization to improve performance without centralizing sensitive driving data, ensuring compliance and enhancing vehicle safety.

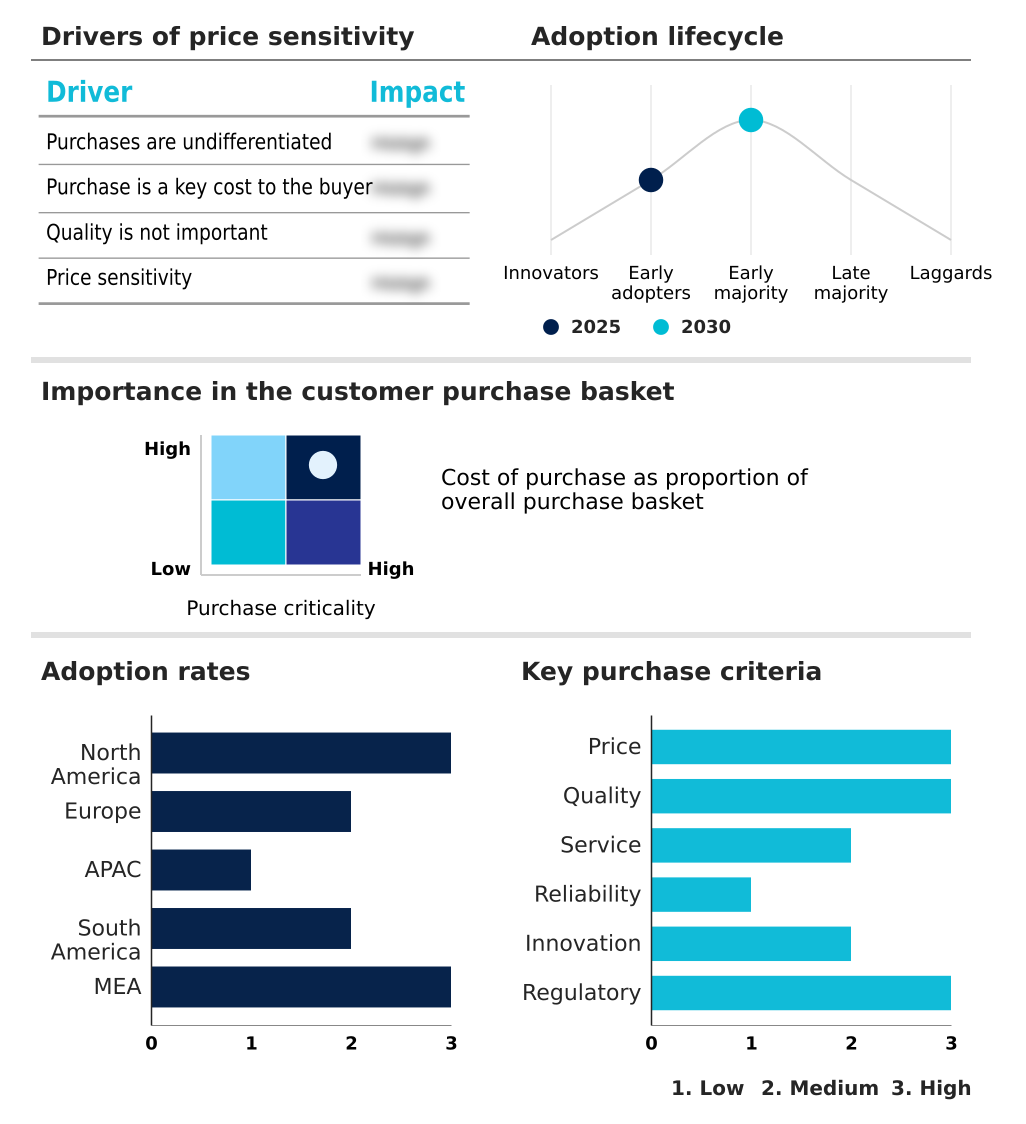
Customer Landscape Analysis for the Ai Inference Optimization Software Market

The ai inference optimization software market forecasting report includes the adoption lifecycle of the market, covering from the innovator’s stage to the laggard’s stage. It focuses on adoption rates in different regions based on penetration. Furthermore, the ai inference optimization software market report also includes key purchase criteria and drivers of price sensitivity to help companies evaluate and develop their market growth analysis strategies.

Competitive Landscape of the Ai Inference Optimization Software Market

Companies are implementing various strategies, such as strategic alliances, partnerships, mergers and acquisitions, geographical expansion, and product/service launches, to enhance their presence in the ai inference optimization software market industry.

Advanced Micro Devices Inc. - Offerings include integrated software stacks and AI development toolkits for model optimization, quantization, and deployment targeting proprietary GPU and AI processor hardware for enhanced performance.

The industry research and growth report includes detailed analyses of the competitive landscape of the market and information about key companies, including:

  • Advanced Micro Devices Inc.
  • Amazon.com Inc.
  • Blaize
  • Cerebras Systems Inc.
  • Edgeimpulse Inc.
  • Google LLC
  • Graphcore Ltd.
  • Groq Inc.
  • Hailo Technologies Ltd.
  • Hugging Face Inc.
  • IBM Corp.
  • Intel Corp.
  • Latent AI Inc.
  • Microsoft Corp.
  • Modular Inc.
  • NVIDIA Corp.
  • Qualcomm Inc.
  • Red Hat Inc.
  • SambaNova Systems Inc.
  • Syntiant Corp.

Qualitative and quantitative analysis of companies has been conducted to help clients understand the wider business environment as well as the strengths and weaknesses of key industry players. Data is qualitatively analyzed to categorize companies as pure play, category-focused, industry-focused, and diversified; it is quantitatively analyzed to categorize companies as dominant, leading, strong, tentative, and weak.

Recent Developments in the Ai Inference Optimization Software Market

  • In March, 2025, Qualcomm Inc. launched the AI Hub, a library of over one hundred pre-optimized models, to streamline the deployment of high-performance AI on Snapdragon mobile and industrial platforms.
  • In May, 2025, Modular Inc. released a significant update to its MAX platform, introducing a universal kernel library designed to optimize execution patterns across both x86 and ARM architectures for seamless cross-platform deployment.
  • In September, 2025, Microsoft Corp. enhanced its ONNX Runtime with an advanced kernel optimization update, enabling the execution of large language models on standard servers through a novel 4-bit quantization strategy.
  • In October, 2025, Hailo Technologies Ltd. introduced a specialized compression toolkit for the automotive sector in APAC, allowing complex vision transformers to be deployed on local hardware for advanced driver-assistance systems.

Research Analyst Overview: Ai Inference Optimization Software Market

Boardroom-level investment decisions are shifting from raw hardware acquisition to sophisticated software strategies that maximize the efficiency of existing compute infrastructure. The adoption of model quantization and knowledge distillation is no longer a niche technical exercise but a core component of managing operational expenditures.

For instance, a telecommunications firm can use neural network pruning to deploy complex network monitoring models on existing server hardware, delaying a multi-million dollar capital expenditure cycle. This move toward software-defined hardware is governed by interoperability standards like the Open Neural Network Exchange (ONNX), which ensures cross-platform ml deployment.

Key technologies such as automatic kernel generation and sparse model acceleration are enabling this shift. The ability to perform runtime acceleration and gpu inference optimization is now a critical vendor selection criterion.

This focus on computational efficiency in ai is essential for enabling real-time ai processing, particularly for low-latency llm serving and on-device machine learning applications, ultimately shaping the entire ai model deployment lifecycle.

Dive into Technavio’s robust research methodology, blending expert interviews, extensive data synthesis, and validated models for unparalleled Ai Inference Optimization Software Market insights. See full methodology.

Request Free Sample

Market Scope
Page number 299
Base year 2025
Historic period 2020-2024
Forecast period 2026-2030
Growth momentum & CAGR Accelerate at a CAGR of 22.1%
Market growth 2026-2030 USD 3721.2 million
Market structure Fragmented
YoY growth 2025-2026(%) 20.3%
Key countries US, Canada, Mexico, Germany, UK, France, Italy, The Netherlands, Spain, China, Japan, India, South Korea, Australia, Indonesia, Brazil, Argentina, Colombia, Saudi Arabia, UAE, South Africa, Israel and Turkey
Competitive landscape Leading Companies, Market Positioning of Companies, Competitive Strategies, and Industry Risks

Ai Inference Optimization Software Market: Key Questions Answered in This Report

  • What is the expected growth of the Ai Inference Optimization Software Market between 2026 and 2030?

    • The Ai Inference Optimization Software Market is expected to grow by USD 3.72 billion during 2026-2030, registering a CAGR of 22.1%. Year-over-year growth in 2026 is estimated at 20.3%%. This acceleration is shaped by escalating demand for real-time processing at network edge, which is intensifying demand across multiple end-use verticals covered in the report.

  • What segmentation does the market report cover?

    • The report is segmented by Component (Model optimization tools, Inference runtimes and engines, Platforms and frameworks, and Services), Deployment (Cloud based, and On premises), Business Segment (Large enterprises, and Small and medium enterprises) and Geography (North America, Europe, APAC, South America, Middle East and Africa). Among these, the Model optimization tools segment is estimated to witness significant growth during the forecast period, driven by rising adoption across key application areas. Each segment includes detailed qualitative and quantitative analysis, along with historical data from 2020-2024 and forecasts through 2030 with year-over-year growth rates.

  • Which regions are analyzed in the report?

    • The report covers North America, Europe, APAC, South America and Middle East and Africa. North America is estimated to contribute 39.6% to market growth during the forecast period. Country-level analysis includes US, Canada, Mexico, Germany, UK, France, Italy, The Netherlands, Spain, China, Japan, India, South Korea, Australia, Indonesia, Brazil, Argentina, Colombia, Saudi Arabia, UAE, South Africa, Israel and Turkey, with dedicated market size tables and year-over-year growth for each.

  • What are the key growth drivers and market challenges?

    • The primary driver is escalating demand for real-time processing at network edge, which is accelerating investment and industry demand. The main challenge is persistence of hardware heterogeneity and interoperability barriers, creating operational barriers for key market participants. The report quantifies the impact of each driver and challenge across 2026 and 2030 with comparative analysis.

  • Who are the major players in the Ai Inference Optimization Software Market?

    • Key vendors include Advanced Micro Devices Inc., Amazon.com Inc., Blaize, Cerebras Systems Inc., Edgeimpulse Inc., Google LLC, Graphcore Ltd., Groq Inc., Hailo Technologies Ltd., Hugging Face Inc., IBM Corp., Intel Corp., Latent AI Inc., Microsoft Corp., Modular Inc., NVIDIA Corp., Qualcomm Inc., Red Hat Inc., SambaNova Systems Inc. and Syntiant Corp.. The report provides qualitative and quantitative analysis categorizing companies as dominant, leading, strong, tentative, and weak based on their market positioning. Company profiles include business segment analysis, SWOT assessment, key offerings, and recent strategic developments.

Ai Inference Optimization Software Market Research Insights

Market dynamics are shaped by the need to balance computational power with operational expenditure, driving adoption of specialized optimization tools. The rapid expansion of the APAC market, which is projected to grow at a CAGR of 23.1%, is compelling enterprises to find methods for reducing ai carbon footprint in line with corporate ESG mandates.

In practice, a large e-commerce provider utilizes inference optimization software to refine its recommendation engines, enabling efficient model optimization for arm cpus prevalent in its server farms. This focus on sustainable ai computing helps manage the high costs associated with scaling services.

The technical hurdles in achieving this balance, particularly the latency vs accuracy tradeoff, remain a central focus for software vendors developing the next generation of ai chipset software stacks and supporting frameworks.

We can help! Our analysts can customize this ai inference optimization software market research report to meet your requirements.

Get in touch

1. Executive Summary

1.1 Market overview

Executive Summary - Chart on Market Overview
Executive Summary - Data Table on Market Overview
Executive Summary - Chart on Global Market Characteristics
Executive Summary - Chart on Market by Geography
Executive Summary - Chart on Market Segmentation by Component
Executive Summary - Chart on Market Segmentation by Deployment
Executive Summary - Chart on Market Segmentation by Business Segment
Executive Summary - Chart on Incremental Growth
Executive Summary - Data Table on Incremental Growth
Executive Summary - Chart on Company Market Positioning

2. Technavio Analysis

2.1 Analysis of price sensitivity, lifecycle, customer purchase basket, adoption rates, and purchase criteria

2.2 Criticality of inputs and Factors of differentiation

Chart on Overview on criticality of inputs and factors of differentiation

2.3 Factors of disruption

Chart on Overview on factors of disruption

2.4 Impact of drivers and challenges

Chart on Impact of drivers and challenges in 2025 and 2030

3. Market Landscape

3.1 Market ecosystem

Chart on Parent Market
Data Table on - Parent Market

3.2 Market characteristics

Chart on Market characteristics analysis

3.3 Value chain analysis

Chart on Value chain analysis

4. Market Sizing

4.1 Market definition

Data Table on Offerings of companies included in the market definition

4.2 Market segment analysis

Market segments

4.3 Market size 2025

4.4 Market outlook: Forecast for 2025-2030

Chart on Global - Market size and forecast 2025-2030 ($ million)
Data Table on Global - Market size and forecast 2025-2030 ($ million)
Chart on Global Market: Year-over-year growth 2025-2030 (%)
Data Table on Global Market: Year-over-year growth 2025-2030 (%)

5. Historic Market Size

5.1 Global AI Inference Optimization Software Market 2020 - 2024

Historic Market Size - Data Table on Global AI Inference Optimization Software Market 2020 - 2024 ($ million)

5.2 Component segment analysis 2020 - 2024

Historic Market Size - Component Segment 2020 - 2024 ($ million)

5.3 Deployment segment analysis 2020 - 2024

Historic Market Size - Deployment Segment 2020 - 2024 ($ million)

5.4 Business segment analysis 2020 - 2024

Historic Market Size - Business Segment 2020 - 2024 ($ million)

5.5 Geography segment analysis 2020 - 2024

Historic Market Size - Geography Segment 2020 - 2024 ($ million)

5.6 Country segment analysis 2020 - 2024

Historic Market Size - Country Segment 2020 - 2024 ($ million)

6. Five Forces Analysis

6.1 Five forces summary

Five forces analysis - Comparison between 2025 and 2030

6.2 Bargaining power of buyers

Bargaining power of buyers - Impact of key factors 2025 and 2030

6.3 Bargaining power of suppliers

Bargaining power of suppliers - Impact of key factors in 2025 and 2030

6.4 Threat of new entrants

Threat of new entrants - Impact of key factors in 2025 and 2030

6.5 Threat of substitutes

Threat of substitutes - Impact of key factors in 2025 and 2030

6.6 Threat of rivalry

Threat of rivalry - Impact of key factors in 2025 and 2030

6.7 Market condition

Chart on Market condition - Five forces 2025 and 2030

7. Market Segmentation by Component

7.1 Market segments

Chart on Component - Market share 2025-2030 (%)
Data Table on Component - Market share 2025-2030 (%)

7.2 Comparison by Component

Chart on Comparison by Component
Data Table on Comparison by Component

7.3 Model optimization tools - Market size and forecast 2025-2030

Chart on Model optimization tools - Market size and forecast 2025-2030 ($ million)
Data Table on Model optimization tools - Market size and forecast 2025-2030 ($ million)
Chart on Model optimization tools - Year-over-year growth 2025-2030 (%)
Data Table on Model optimization tools - Year-over-year growth 2025-2030 (%)

7.4 Inference runtimes and engines - Market size and forecast 2025-2030

Chart on Inference runtimes and engines - Market size and forecast 2025-2030 ($ million)
Data Table on Inference runtimes and engines - Market size and forecast 2025-2030 ($ million)
Chart on Inference runtimes and engines - Year-over-year growth 2025-2030 (%)
Data Table on Inference runtimes and engines - Year-over-year growth 2025-2030 (%)

7.5 Platforms and frameworks - Market size and forecast 2025-2030

Chart on Platforms and frameworks - Market size and forecast 2025-2030 ($ million)
Data Table on Platforms and frameworks - Market size and forecast 2025-2030 ($ million)
Chart on Platforms and frameworks - Year-over-year growth 2025-2030 (%)
Data Table on Platforms and frameworks - Year-over-year growth 2025-2030 (%)

7.6 Services - Market size and forecast 2025-2030

Chart on Services - Market size and forecast 2025-2030 ($ million)
Data Table on Services - Market size and forecast 2025-2030 ($ million)
Chart on Services - Year-over-year growth 2025-2030 (%)
Data Table on Services - Year-over-year growth 2025-2030 (%)

7.7 Market opportunity by Component

Market opportunity by Component ($ million)
Data Table on Market opportunity by Component ($ million)

8. Market Segmentation by Deployment

8.1 Market segments

Chart on Deployment - Market share 2025-2030 (%)
Data Table on Deployment - Market share 2025-2030 (%)

8.2 Comparison by Deployment

Chart on Comparison by Deployment
Data Table on Comparison by Deployment

8.3 Cloud based - Market size and forecast 2025-2030

Chart on Cloud based - Market size and forecast 2025-2030 ($ million)
Data Table on Cloud based - Market size and forecast 2025-2030 ($ million)
Chart on Cloud based - Year-over-year growth 2025-2030 (%)
Data Table on Cloud based - Year-over-year growth 2025-2030 (%)

8.4 On premises - Market size and forecast 2025-2030

Chart on On premises - Market size and forecast 2025-2030 ($ million)
Data Table on On premises - Market size and forecast 2025-2030 ($ million)
Chart on On premises - Year-over-year growth 2025-2030 (%)
Data Table on On premises - Year-over-year growth 2025-2030 (%)

8.5 Market opportunity by Deployment

Market opportunity by Deployment ($ million)
Data Table on Market opportunity by Deployment ($ million)

9. Market Segmentation by Business Segment

9.1 Market segments

Chart on Market Segmentation by Business Segment - Market share 2025-2030 (%)
Data Table on Market Segmentation by Business Segment - Market share 2025-2030 (%)

9.2 Comparison by Market Segmentation by Business Segment

Chart on Comparison by Market Segmentation by Business Segment
Data Table on Comparison by Market Segmentation by Business Segment

9.3 Large enterprises - Market size and forecast 2025-2030

Chart on Large enterprises - Market size and forecast 2025-2030 ($ million)
Data Table on Large enterprises - Market size and forecast 2025-2030 ($ million)
Chart on Large enterprises - Year-over-year growth 2025-2030 (%)
Data Table on Large enterprises - Year-over-year growth 2025-2030 (%)

9.4 Small and medium enterprises - Market size and forecast 2025-2030

Chart on Small and medium enterprises - Market size and forecast 2025-2030 ($ million)
Data Table on Small and medium enterprises - Market size and forecast 2025-2030 ($ million)
Chart on Small and medium enterprises - Year-over-year growth 2025-2030 (%)
Data Table on Small and medium enterprises - Year-over-year growth 2025-2030 (%)

9.5 Market opportunity by Market Segmentation by Business Segment

Market opportunity by Market Segmentation by Business Segment ($ million)
Data Table on Market opportunity by Market Segmentation by Business Segment ($ million)

10. Customer Landscape

10.1 Customer landscape overview

Analysis of price sensitivity, lifecycle, customer purchase basket, adoption rates, and purchase criteria

11. Geographic Landscape

11.1 Geographic segmentation

Chart on Market share by geography 2025-2030 (%)
Data Table on Market share by geography 2025-2030 (%)

11.2 Geographic comparison

Chart on Geographic comparison
Data Table on Geographic comparison

11.3 North America - Market size and forecast 2025-2030

Chart on North America - Market size and forecast 2025-2030 ($ million)
Data Table on North America - Market size and forecast 2025-2030 ($ million)
Chart on North America - Year-over-year growth 2025-2030 (%)
Data Table on North America - Year-over-year growth 2025-2030 (%)
Chart on Regional Comparison - North America
Data Table on Regional Comparison - North America

11.3.1 US - Market size and forecast 2025-2030

Chart on US - Market size and forecast 2025-2030 ($ million)
Data Table on US - Market size and forecast 2025-2030 ($ million)
Chart on US - Year-over-year growth 2025-2030 (%)
Data Table on US - Year-over-year growth 2025-2030 (%)

11.3.2 Canada - Market size and forecast 2025-2030

Chart on Canada - Market size and forecast 2025-2030 ($ million)
Data Table on Canada - Market size and forecast 2025-2030 ($ million)
Chart on Canada - Year-over-year growth 2025-2030 (%)
Data Table on Canada - Year-over-year growth 2025-2030 (%)

11.3.3 Mexico - Market size and forecast 2025-2030

Chart on Mexico - Market size and forecast 2025-2030 ($ million)
Data Table on Mexico - Market size and forecast 2025-2030 ($ million)
Chart on Mexico - Year-over-year growth 2025-2030 (%)
Data Table on Mexico - Year-over-year growth 2025-2030 (%)

11.4 Europe - Market size and forecast 2025-2030

Chart on Europe - Market size and forecast 2025-2030 ($ million)
Data Table on Europe - Market size and forecast 2025-2030 ($ million)
Chart on Europe - Year-over-year growth 2025-2030 (%)
Data Table on Europe - Year-over-year growth 2025-2030 (%)
Chart on Regional Comparison - Europe
Data Table on Regional Comparison - Europe

11.4.1 Germany - Market size and forecast 2025-2030

Chart on Germany - Market size and forecast 2025-2030 ($ million)
Data Table on Germany - Market size and forecast 2025-2030 ($ million)
Chart on Germany - Year-over-year growth 2025-2030 (%)
Data Table on Germany - Year-over-year growth 2025-2030 (%)

11.4.2 UK - Market size and forecast 2025-2030

Chart on UK - Market size and forecast 2025-2030 ($ million)
Data Table on UK - Market size and forecast 2025-2030 ($ million)
Chart on UK - Year-over-year growth 2025-2030 (%)
Data Table on UK - Year-over-year growth 2025-2030 (%)

11.4.3 France - Market size and forecast 2025-2030

Chart on France - Market size and forecast 2025-2030 ($ million)
Data Table on France - Market size and forecast 2025-2030 ($ million)
Chart on France - Year-over-year growth 2025-2030 (%)
Data Table on France - Year-over-year growth 2025-2030 (%)

11.4.4 Italy - Market size and forecast 2025-2030

Chart on Italy - Market size and forecast 2025-2030 ($ million)
Data Table on Italy - Market size and forecast 2025-2030 ($ million)
Chart on Italy - Year-over-year growth 2025-2030 (%)
Data Table on Italy - Year-over-year growth 2025-2030 (%)

11.4.5 The Netherlands - Market size and forecast 2025-2030

Chart on The Netherlands - Market size and forecast 2025-2030 ($ million)
Data Table on The Netherlands - Market size and forecast 2025-2030 ($ million)
Chart on The Netherlands - Year-over-year growth 2025-2030 (%)
Data Table on The Netherlands - Year-over-year growth 2025-2030 (%)

11.4.6 Spain - Market size and forecast 2025-2030

Chart on Spain - Market size and forecast 2025-2030 ($ million)
Data Table on Spain - Market size and forecast 2025-2030 ($ million)
Chart on Spain - Year-over-year growth 2025-2030 (%)
Data Table on Spain - Year-over-year growth 2025-2030 (%)

11.5 APAC - Market size and forecast 2025-2030

Chart on APAC - Market size and forecast 2025-2030 ($ million)
Data Table on APAC - Market size and forecast 2025-2030 ($ million)
Chart on APAC - Year-over-year growth 2025-2030 (%)
Data Table on APAC - Year-over-year growth 2025-2030 (%)
Chart on Regional Comparison - APAC
Data Table on Regional Comparison - APAC

11.5.1 China - Market size and forecast 2025-2030

Chart on China - Market size and forecast 2025-2030 ($ million)
Data Table on China - Market size and forecast 2025-2030 ($ million)
Chart on China - Year-over-year growth 2025-2030 (%)
Data Table on China - Year-over-year growth 2025-2030 (%)

11.5.2 Japan - Market size and forecast 2025-2030

Chart on Japan - Market size and forecast 2025-2030 ($ million)
Data Table on Japan - Market size and forecast 2025-2030 ($ million)
Chart on Japan - Year-over-year growth 2025-2030 (%)
Data Table on Japan - Year-over-year growth 2025-2030 (%)

11.5.3 India - Market size and forecast 2025-2030

Chart on India - Market size and forecast 2025-2030 ($ million)
Data Table on India - Market size and forecast 2025-2030 ($ million)
Chart on India - Year-over-year growth 2025-2030 (%)
Data Table on India - Year-over-year growth 2025-2030 (%)

11.5.4 South Korea - Market size and forecast 2025-2030

Chart on South Korea - Market size and forecast 2025-2030 ($ million)
Data Table on South Korea - Market size and forecast 2025-2030 ($ million)
Chart on South Korea - Year-over-year growth 2025-2030 (%)
Data Table on South Korea - Year-over-year growth 2025-2030 (%)

11.5.5 Australia - Market size and forecast 2025-2030

Chart on Australia - Market size and forecast 2025-2030 ($ million)
Data Table on Australia - Market size and forecast 2025-2030 ($ million)
Chart on Australia - Year-over-year growth 2025-2030 (%)
Data Table on Australia - Year-over-year growth 2025-2030 (%)

11.5.6 Indonesia - Market size and forecast 2025-2030

Chart on Indonesia - Market size and forecast 2025-2030 ($ million)
Data Table on Indonesia - Market size and forecast 2025-2030 ($ million)
Chart on Indonesia - Year-over-year growth 2025-2030 (%)
Data Table on Indonesia - Year-over-year growth 2025-2030 (%)

11.6 South America - Market size and forecast 2025-2030

Chart on South America - Market size and forecast 2025-2030 ($ million)
Data Table on South America - Market size and forecast 2025-2030 ($ million)
Chart on South America - Year-over-year growth 2025-2030 (%)
Data Table on South America - Year-over-year growth 2025-2030 (%)
Chart on Regional Comparison - South America
Data Table on Regional Comparison - South America

11.6.1 Brazil - Market size and forecast 2025-2030

Chart on Brazil - Market size and forecast 2025-2030 ($ million)
Data Table on Brazil - Market size and forecast 2025-2030 ($ million)
Chart on Brazil - Year-over-year growth 2025-2030 (%)
Data Table on Brazil - Year-over-year growth 2025-2030 (%)

11.6.2 Argentina - Market size and forecast 2025-2030

Chart on Argentina - Market size and forecast 2025-2030 ($ million)
Data Table on Argentina - Market size and forecast 2025-2030 ($ million)
Chart on Argentina - Year-over-year growth 2025-2030 (%)
Data Table on Argentina - Year-over-year growth 2025-2030 (%)

11.6.3 Colombia - Market size and forecast 2025-2030

Chart on Colombia - Market size and forecast 2025-2030 ($ million)
Data Table on Colombia - Market size and forecast 2025-2030 ($ million)
Chart on Colombia - Year-over-year growth 2025-2030 (%)
Data Table on Colombia - Year-over-year growth 2025-2030 (%)

11.7 Middle East and Africa - Market size and forecast 2025-2030

Chart on Middle East and Africa - Market size and forecast 2025-2030 ($ million)
Data Table on Middle East and Africa - Market size and forecast 2025-2030 ($ million)
Chart on Middle East and Africa - Year-over-year growth 2025-2030 (%)
Data Table on Middle East and Africa - Year-over-year growth 2025-2030 (%)
Chart on Regional Comparison - Middle East and Africa
Data Table on Regional Comparison - Middle East and Africa

11.7.1 Saudi Arabia - Market size and forecast 2025-2030

Chart on Saudi Arabia - Market size and forecast 2025-2030 ($ million)
Data Table on Saudi Arabia - Market size and forecast 2025-2030 ($ million)
Chart on Saudi Arabia - Year-over-year growth 2025-2030 (%)
Data Table on Saudi Arabia - Year-over-year growth 2025-2030 (%)

11.7.2 UAE - Market size and forecast 2025-2030

Chart on UAE - Market size and forecast 2025-2030 ($ million)
Data Table on UAE - Market size and forecast 2025-2030 ($ million)
Chart on UAE - Year-over-year growth 2025-2030 (%)
Data Table on UAE - Year-over-year growth 2025-2030 (%)

11.7.3 South Africa - Market size and forecast 2025-2030

Chart on South Africa - Market size and forecast 2025-2030 ($ million)
Data Table on South Africa - Market size and forecast 2025-2030 ($ million)
Chart on South Africa - Year-over-year growth 2025-2030 (%)
Data Table on South Africa - Year-over-year growth 2025-2030 (%)

11.7.4 Israel - Market size and forecast 2025-2030

Chart on Israel - Market size and forecast 2025-2030 ($ million)
Data Table on Israel - Market size and forecast 2025-2030 ($ million)
Chart on Israel - Year-over-year growth 2025-2030 (%)
Data Table on Israel - Year-over-year growth 2025-2030 (%)

11.7.5 Turkey - Market size and forecast 2025-2030

Chart on Turkey - Market size and forecast 2025-2030 ($ million)
Data Table on Turkey - Market size and forecast 2025-2030 ($ million)
Chart on Turkey - Year-over-year growth 2025-2030 (%)
Data Table on Turkey - Year-over-year growth 2025-2030 (%)

11.8 Market opportunity by geography

Market opportunity by geography ($ million)
Data Tables on Market opportunity by geography ($ million)

12. Drivers, Challenges, and Opportunity

12.1 Market drivers

Escalating demand for real-time processing at network edge
Rapid proliferation of generative AI and large language models
Growing corporate commitment to sustainability and energy efficiency

12.2 Market challenges

Persistence of hardware heterogeneity and interoperability barriers
Technical hurdles in maintaining predictive accuracy during model compression
Rapid velocity of neural architecture evolution and software obsolescence

12.3 Impact of drivers and challenges

Impact of drivers and challenges in 2025 and 2030

12.4 Market opportunities

Proliferation of hardware-agnostic compilation and interoperability standards
Transition toward dynamic and runtime-specific optimization for generative architectures
Expansion of TinyML and On-device personalization in emerging markets

13. Competitive Landscape

13.1 Overview

13.2

Overview on criticality of inputs and factors of differentiation

13.3 Landscape disruption

Overview on factors of disruption

13.4 Industry risks

Impact of key risks on business

14. Competitive Analysis

14.1 Companies profiled

Companies covered

14.2 Company ranking index

14.3 Market positioning of companies

Matrix on companies position and classification

14.4 Advanced Micro Devices Inc.

Advanced Micro Devices Inc. - Overview
Advanced Micro Devices Inc. - Business segments
Advanced Micro Devices Inc. - Key news
Advanced Micro Devices Inc. - Key offerings
Advanced Micro Devices Inc. - Segment focus
SWOT

14.5 Amazon.com Inc.

Amazon.com Inc. - Overview
Amazon.com Inc. - Business segments
Amazon.com Inc. - Key news
Amazon.com Inc. - Key offerings
Amazon.com Inc. - Segment focus
SWOT

14.6 Blaize

Blaize - Overview
Blaize - Product / Service
Blaize - Key offerings
SWOT

14.7 Edgeimpulse Inc.

Edgeimpulse Inc. - Overview
Edgeimpulse Inc. - Product / Service
Edgeimpulse Inc. - Key offerings
SWOT

14.8 Google LLC

Google LLC - Overview
Google LLC - Product / Service
Google LLC - Key offerings
SWOT

14.9 Groq Inc.

Groq Inc. - Overview
Groq Inc. - Product / Service
Groq Inc. - Key offerings
SWOT

14.10 Hugging Face Inc.

Hugging Face Inc. - Overview
Hugging Face Inc. - Product / Service
Hugging Face Inc. - Key offerings
SWOT

14.11 IBM Corp.

IBM Corp. - Overview
IBM Corp. - Business segments
IBM Corp. - Key news
IBM Corp. - Key offerings
IBM Corp. - Segment focus
SWOT

14.12 Intel Corp.

Intel Corp. - Overview
Intel Corp. - Business segments
Intel Corp. - Key news
Intel Corp. - Key offerings
Intel Corp. - Segment focus
SWOT

14.13 Microsoft Corp.

Microsoft Corp. - Overview
Microsoft Corp. - Business segments
Microsoft Corp. - Key news
Microsoft Corp. - Key offerings
Microsoft Corp. - Segment focus
SWOT

14.14 Modular Inc.

Modular Inc. - Overview
Modular Inc. - Product / Service
Modular Inc. - Key offerings
SWOT

14.15 NVIDIA Corp.

NVIDIA Corp. - Overview
NVIDIA Corp. - Business segments
NVIDIA Corp. - Key news
NVIDIA Corp. - Key offerings
NVIDIA Corp. - Segment focus
SWOT

14.16 Qualcomm Inc.

Qualcomm Inc. - Overview
Qualcomm Inc. - Business segments
Qualcomm Inc. - Key news
Qualcomm Inc. - Key offerings
Qualcomm Inc. - Segment focus
SWOT

14.17 Red Hat Inc.

Red Hat Inc. - Overview
Red Hat Inc. - Product / Service
Red Hat Inc. - Key offerings
SWOT

14.18 Syntiant Corp.

Syntiant Corp. - Overview
Syntiant Corp. - Product / Service
Syntiant Corp. - Key offerings
SWOT

15. Appendix

15.1 Scope of the report

Market definition
Objectives
Notes and caveats

15.2 Inclusions and exclusions checklist

Inclusions checklist
Exclusions checklist

15.3 Currency conversion rates for US$

15.4 Research methodology

15.5 Data procurement

Information sources

15.6 Data validation

15.7 Validation techniques employed for market sizing

15.8 Data synthesis

15.9 360 degree market analysis

15.10 List of abbreviations

Research Methodology

Technavio presents a detailed picture of the market by way of study, synthesis, and summation of data from multiple sources. The analysts have presented the various facets of the market with a particular focus on identifying the key industry influencers. The data thus presented is comprehensive, reliable, and the result of extensive research, both primary and secondary.

INFORMATION SOURCES

Primary sources

  • Manufacturers and suppliers
  • Channel partners
  • Industry experts
  • Strategic decision makers

Secondary sources

  • Industry journals and periodicals
  • Government data
  • Financial reports of key industry players
  • Historical data
  • Press releases

DATA ANALYSIS

Data Synthesis

  • Collation of data
  • Estimation of key figures
  • Analysis of derived insights

Data Validation

  • Triangulation with data models
  • Reference against proprietary databases
  • Corroboration with industry experts

REPORT WRITING

Qualitative

  • Market drivers
  • Market challenges
  • Market trends
  • Five forces analysis

Quantitative

  • Market size and forecast
  • Market segmentation
  • Geographical insights
  • Competitive landscape

Interested in this report?

Get your sample now to see our research methodology and insights!

Download Now

Frequently Asked Questions

Ai Inference Optimization Software market growth will increase by USD 3721.2 million during 2026-2030.

The Ai Inference Optimization Software market is expected to grow at a CAGR of 22.1% during 2026-2030.

Ai Inference Optimization Software market is segmented by Component (Model optimization tools, Inference runtimes and engines, Platforms and frameworks, Services) Deployment (Cloud based, On premises) Business segment (Large enterprises, Small and medium enterprises)

Advanced Micro Devices Inc., Amazon.com Inc., Blaize, Cerebras Systems Inc., Edgeimpulse Inc., Google LLC, Graphcore Ltd., Groq Inc., Hailo Technologies Ltd., Hugging Face Inc., IBM Corp., Intel Corp., Latent AI Inc., Microsoft Corp., Modular Inc., NVIDIA Corp., Qualcomm Inc., Red Hat Inc., SambaNova Systems Inc., Syntiant Corp. are a few of the key vendors in the Ai Inference Optimization Software market.

North America will register the highest growth rate of 39.6% among the other regions. Therefore, the Ai Inference Optimization Software market in North America is expected to garner significant business opportunities for the vendors during the forecast period.

US, Canada, Mexico, Germany, UK, France, Italy, The Netherlands, Spain, China, Japan, India, South Korea, Australia, Indonesia, Brazil, Argentina, Colombia, Saudi Arabia, UAE, South Africa, Israel, Turkey

  • Escalating demand for real-time processing at network edge is the driving factor this market.

The Ai Inference Optimization Software market vendors should focus on grabbing business opportunities from the Component segment as it accounted for the largest market share in the base year.
RIA - Research AI Assistant
Ask RIA