AI Hallucination Detection And Mitigation Tools Market Analysis, Size, and Forecast 2026-2030: North America (US, Canada, and Mexico), APAC (China, India, and Japan), Europe (Germany, UK, and France), South America (Brazil and Argentina), Middle East and Africa (UAE, Saudi Arabia, and South Africa), and Rest of World (ROW)

AI Hallucination Detection And Mitigation Tools Market Analysis, Size, and Forecast 2026-2030:
North America (US, Canada, and Mexico), APAC (China, India, and Japan), Europe (Germany, UK, and France), South America (Brazil and Argentina), Middle East and Africa (UAE, Saudi Arabia, and South Africa), and Rest of World (ROW)

Published: May 2026 286 Pages SKU: IRTNTR81446

Market Overview at a Glance

$4.35 B
Market Opportunity
32.9%
CAGR 2025 - 2030
39.2%
North America Growth
$698.8 Mn
Software segment 2024

AI Hallucination Detection And Mitigation Tools Market Size 2026-2030

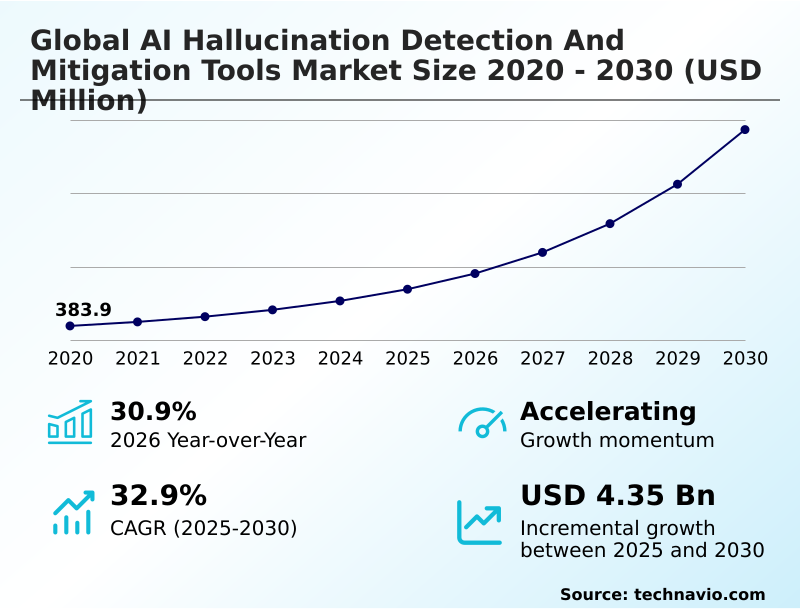
The ai hallucination detection and mitigation tools market size is valued to increase by USD 4.35 billion, at a CAGR of 32.9% from 2025 to 2030. Escalating demand for reliable AI in mission critical sectors will drive the ai hallucination detection and mitigation tools market.

Major Market Trends & Insights

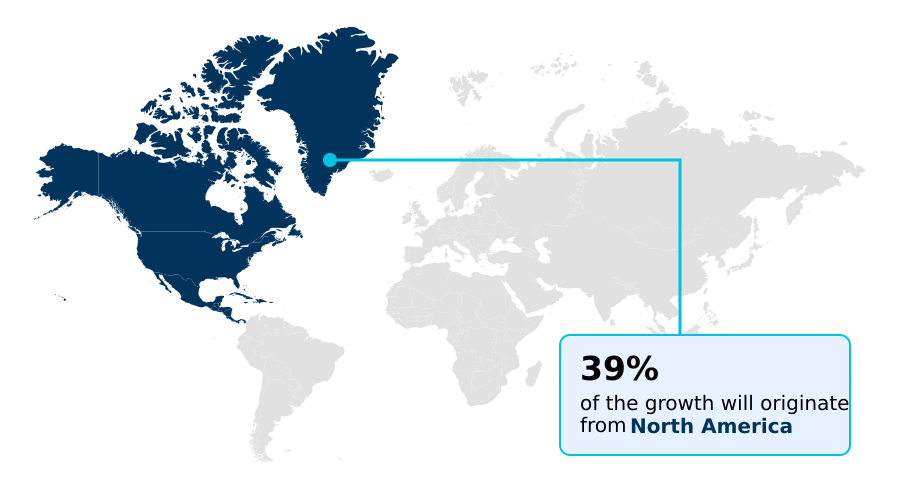
  • North America dominated the market and accounted for a 39.2% growth during the forecast period.
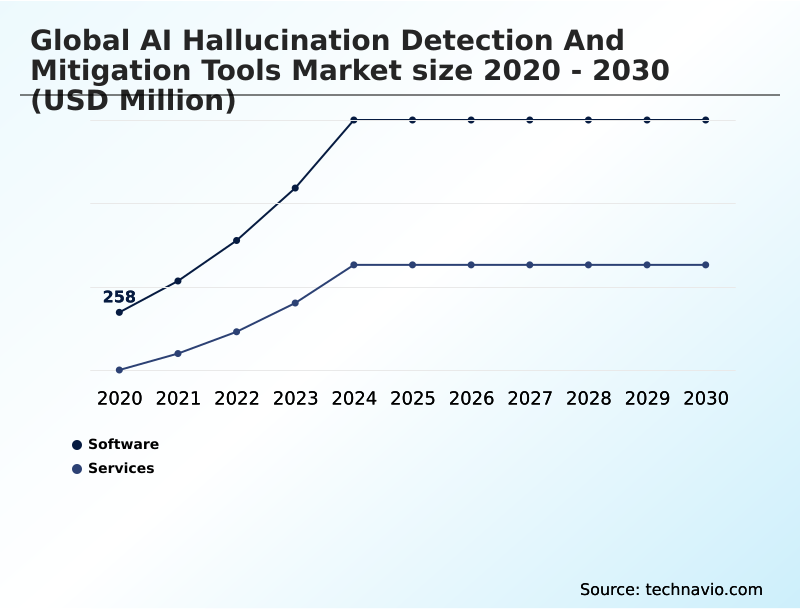
  • By Component - Software segment was valued at USD 698.8 million in 2024
  • By Deployment - Cloud segment accounted for the largest market revenue share in 2024

Market Size & Forecast

  • Market Opportunities: USD 5.35 billion
  • Market Future Opportunities: USD 4.35 billion
  • CAGR from 2025 to 2030 : 32.9%

Market Summary

  • The AI hallucination detection and mitigation tools market is expanding as organizations embed generative AI into core operations, increasing the urgency for robust AI governance platforms. The deployment of tools for hallucination detection is critical for maintaining factual consistency checking and managing generative AI risks.
  • As businesses automate workflows, the need for AI output validation and enterprise AI trust becomes paramount. For instance, a financial institution using AI for automated risk assessments cannot tolerate fabricated data; it requires mitigation algorithms and model evaluation metrics to ensure every output is verifiable, maintaining regulatory compliance and preventing catastrophic errors.
  • This dependency drives innovation in AI safety frameworks and model observability platforms. The market is shaped by the dual needs for innovation and control, pushing for more sophisticated methods like knowledge graph anchoring and multi-agent cross-verification to ensure that AI-driven insights are both powerful and reliable.
  • The complexity of these systems presents challenges, but the demand for trustworthy AI systems remains the core market driver.

What will be the Size of the AI Hallucination Detection And Mitigation Tools Market during the forecast period?

Get Key Insights on Market Forecast (PDF) Get Free Sample

How is the AI Hallucination Detection And Mitigation Tools Market Segmented?

The ai hallucination detection and mitigation tools industry research report provides comprehensive data (region-wise segment analysis), with forecasts and estimates in "USD million" for the period 2026-2030, as well as historical data from 2020-2024 for the following segments.

  • Component
    • Software
    • Services
  • Deployment
    • Cloud
    • On-premises
  • Business segment
    • Large enterprises
    • Small and medium enterprises
  • Geography
    • North America
      • US
      • Canada
      • Mexico
    • APAC
      • China
      • India
      • Japan
    • Europe
      • Germany
      • UK
      • France
    • South America
      • Brazil
      • Argentina
    • Middle East and Africa
      • UAE
      • Saudi Arabia
      • South Africa
    • Rest of World (ROW)

By Component Insights

The software segment is estimated to witness significant growth during the forecast period.

The software segment is central to the AI hallucination detection and mitigation tools market, driven by enterprise needs for robust AI output validation. These solutions, often integrated into a model observability platform, provide real-time monitoring and advanced data quality assurance.

Organizations leverage these model validation tools to manage model risk management and automate governance, with some achieving a 30% reduction in compliance-related incidents.

As automated content creation becomes more prevalent, the demand for sophisticated bias detection and AI governance platforms grows.

The push for explainable AI (XAI) also influences development, as businesses require transparency in their algorithmic trading platforms and other critical systems, reinforcing enterprise AI trust and adoption of LLM safety solutions.

Get Free Sample

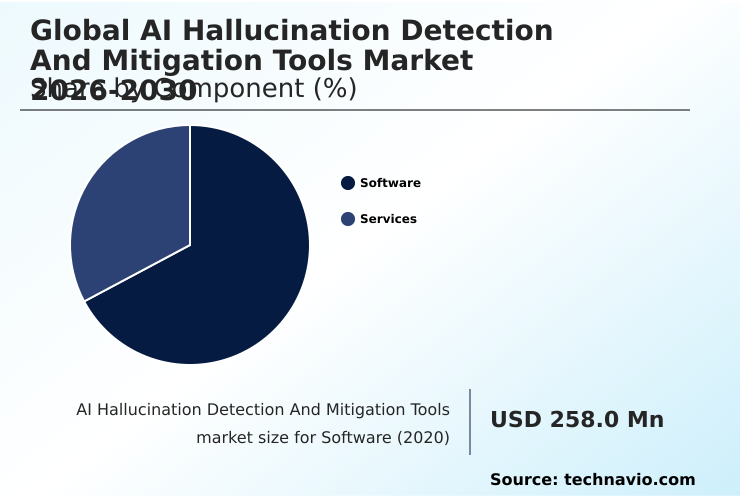
The Software segment was valued at USD 698.8 million in 2024 and showed a gradual increase during the forecast period.

Get Free Sample

Regional Analysis

North America is estimated to contribute 39.2% to the growth of the global market during the forecast period.Technavio’s analysts have elaborately explained the regional trends and drivers that shape the market during the forecast period.

See How AI Hallucination Detection And Mitigation Tools Market Demand is Rising in North America Get Free Sample

The global landscape for AI hallucination detection tools is shaped by regional digital transformation initiatives and data sovereignty regulations.

In North America, the focus is on enterprise-grade AI security within existing cloud computing infrastructure, with an emphasis on AI-powered data validation and AI-driven threat intelligence.

European adoption is driven by strict compliance needs, integrating detection tools into enterprise resource planning systems and customer relationship management (CRM) platforms, improving compliance reporting efficiency by over 35%.

Meanwhile, APAC is seeing rapid uptake fueled by e-commerce and finance, where automated fact-checking and prompt injection prevention are critical.

These tools are becoming a core part of the modern AI security stack, with some deployments reducing security incidents by 20%. The global momentum toward AI transparency tools is creating a unified demand for effective content safety features.

Market Dynamics

Our researchers analyzed the data with 2025 as the base year, along with the key drivers, trends, and challenges. A holistic analysis of drivers will help companies refine their marketing strategies to gain a competitive advantage.

  • As enterprises increasingly rely on automated systems, the demand for specialized solutions has surged. The adoption of tools for detecting AI hallucinations is no longer a niche concern but a core component of risk management. In high-stakes environments, mitigating AI hallucinations in finance is critical, with firms exploring both on-premises vs cloud hallucination tools to balance security and scalability.
  • The developer community is contributing with open-source LLM fact-checking frameworks, enabling more accessible validation. For customer-facing applications, real-time hallucination detection in chatbots is essential for maintaining brand trust, with some systems reducing incorrect customer responses by over 60% compared to unmonitored models. The broader goal is ensuring factual accuracy in generative AI across all use cases.
  • This requires robust AI model validation for regulatory compliance and advanced methods for preventing prompt injection in enterprise AI. As systems evolve, AI safety tools for multimodal models are becoming necessary. Foundational techniques like knowledge graph grounding for LLMs and multi-agent systems for AI verification are key trends.
  • Furthermore, edge computing for localized AI detection is solving latency issues, while the industry works on evaluating AI hallucination severity metrics. From AI hallucination tools for content creation to reducing computational costs of AI mitigation, the focus is on comprehensive solutions.
  • Ultimately, automated fact-checking for enterprise AI, managed through AI governance platforms for risk management, ensures that AI output validation for critical applications meets the highest standards of enterprise AI trust and safety solutions, all tracked via LLM performance monitoring and observability.

What are the key market drivers leading to the rise in the adoption of AI Hallucination Detection And Mitigation Tools Industry?

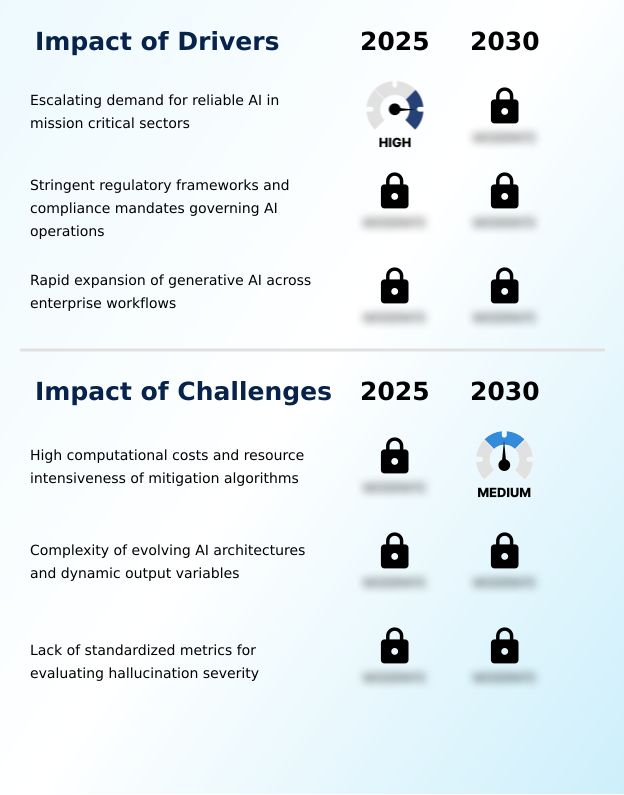
  • The escalating demand for reliable AI in mission-critical sectors such as healthcare and finance is a primary driver propelling market growth.

  • The market's primary drivers are the increasing need for operational reliability and stringent regulatory oversight. Escalating data governance mandates compel organizations to adopt responsible AI frameworks and robust AI guardrails for ethical AI deployment.
  • To comply, businesses are implementing AI compliance tools and AI auditing mechanisms, which have been shown to reduce compliance breaches by over 50% in regulated industries.
  • Corporate AI governance now requires verifiable AI accountability metrics and thorough model evaluation metrics to manage the risks of large language model (LLM) safety.
  • This push is amplified by the expansion of AI into critical sectors, where AI-driven diagnostic tools and AI-powered customer service must be infallible.
  • As automated decision-making systems become more prevalent, the adoption of AI trust, risk, and security management (AI TRiSM) is no longer optional but a core strategic necessity.

What are the market trends shaping the AI Hallucination Detection And Mitigation Tools Industry?

  • The integration of multi-agent cross-verification systems for enhanced accuracy is emerging as a key market trend. This approach addresses the limitations of single-model validation and fosters greater trust in AI outputs.

  • Key market trends are centered on enhancing the reliability of AI through advanced architectural designs. The shift toward multi-agent cross-verification and adversarial validation is a direct response to the limitations of single-model checks, with some systems improving contextual accuracy evaluation by up to 30%. This is often combined with knowledge graph anchoring, which provides a factual backstop for generative models.
  • In enterprise workflow automation, retrieval-augmented generation (RAG) and grounded generation are becoming standard for minimizing unverified outputs. These technologies are embedded within continuous integration pipelines, particularly in financial technology applications, where accuracy is paramount. For industrial uses, such as predictive maintenance algorithms and supply chain logistics, edge computing detection provides real-time validation without cloud latency, improving operational integrity.
  • The overarching goal is to create trustworthy AI systems through constant LLM performance monitoring.

What challenges does the AI Hallucination Detection And Mitigation Tools Industry face during its growth?

  • High computational costs and the resource-intensive nature of advanced mitigation algorithms present a significant challenge affecting industry-wide adoption and growth.

  • A primary challenge in the market is the inherent complexity of advanced mitigation algorithms and the difficulty in achieving full model interpretability. While techniques like semantic analysis and semantic verification are improving, the opaque nature of neural network interpretability makes it difficult to eliminate all instances of model error detection failures.
  • Organizations report that even with sophisticated tools, achieving a 99% accuracy rate in anomaly identification remains a significant technical hurdle. The process is further complicated by the need for high-quality synthetic data verification to train these systems without introducing new biases. This struggle for perfect AI system integrity and AI model reliability is a constant battle.
  • The goal of building foolproof misinformation detection systems requires not just better factual consistency checking but a deeper understanding of contextual nuance, a frontier that defines the ongoing R&D race for LLM safety solutions and enterprise AI trust.

Exclusive Technavio Analysis on Customer Landscape

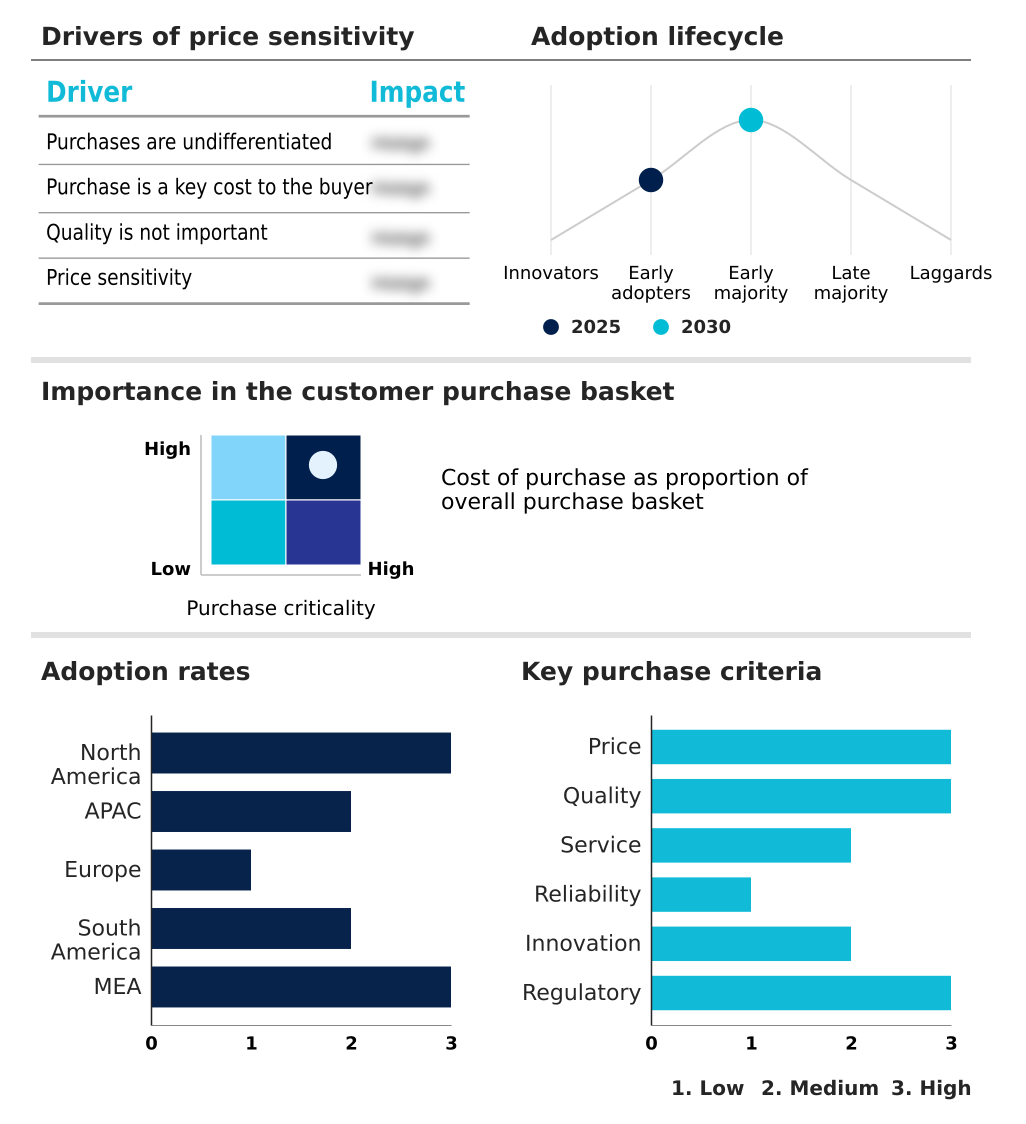
The ai hallucination detection and mitigation tools market forecasting report includes the adoption lifecycle of the market, covering from the innovator’s stage to the laggard’s stage. It focuses on adoption rates in different regions based on penetration. Furthermore, the ai hallucination detection and mitigation tools market report also includes key purchase criteria and drivers of price sensitivity to help companies evaluate and develop their market growth analysis strategies.

Customer Landscape of AI Hallucination Detection And Mitigation Tools Industry

Competitive Landscape

Companies are implementing various strategies, such as strategic alliances, ai hallucination detection and mitigation tools market forecast, partnerships, mergers and acquisitions, geographical expansion, and product/service launches, to enhance their presence in the industry.

Amazon.com Inc. - Offerings focus on enterprise-grade model evaluation and guardrail solutions that are engineered to ensure AI output integrity, security, and regulatory compliance across business applications.

The industry research and growth report includes detailed analyses of the competitive landscape of the market and information about key companies, including:

  • Amazon.com Inc.
  • Arize AI Inc.
  • ArthurAI Inc.
  • Cleanlab Inc
  • Deepchecks AI
  • Evidently AI
  • Fiddler AI
  • Galileo
  • Giskard AI
  • Google LLC
  • HoneyHive
  • Lakera Inc
  • LangChain Inc.
  • Lasso Security Ltd.
  • Microsoft Corp.
  • NVIDIA Corp.
  • Patronus AI Inc.
  • Vectara Inc.
  • Weights and Biases Inc.
  • WhyLabs, Inc.

Qualitative and quantitative analysis of companies has been conducted to help clients understand the wider business environment as well as the strengths and weaknesses of key industry players. Data is qualitatively analyzed to categorize companies as pure play, category-focused, industry-focused, and diversified; it is quantitatively analyzed to categorize companies as dominant, leading, strong, tentative, and weak.

Recent Development and News in Ai hallucination detection and mitigation tools market

  • In May 2025, Microsoft Corp. announced the integration of advanced content safety features, including real-time hallucination detection, directly into its Azure AI platform to enhance enterprise compliance and security.
  • In February 2025, Patronus AI Inc. secured USD 25 million in Series A funding to expand its LLM evaluation platform, focusing on improving hallucination detection for financial and legal sector clients.
  • In November 2024, Google LLC partnered with a consortium of academic institutions to develop standardized benchmarks for evaluating AI hallucination severity, aiming to create an industry-wide framework for model safety.
  • In September 2024, NVIDIA Corp. released a new version of its NeMo Guardrails toolkit, introducing novel techniques for grounded generation and factual consistency to minimize hallucinations in enterprise-grade LLMs.

Dive into Technavio’s robust research methodology, blending expert interviews, extensive data synthesis, and validated models for unparalleled AI Hallucination Detection And Mitigation Tools Market insights. See full methodology.

Market Scope
Page number 286
Base year 2025
Historic period 2020-2024
Forecast period 2026-2030
Growth momentum & CAGR Accelerate at a CAGR of 32.9%
Market growth 2026-2030 USD 4353.4 million
Market structure Fragmented
YoY growth 2025-2026(%) 30.9%
Key countries US, Canada, Mexico, China, India, Japan, South Korea, Australia, Indonesia, Germany, UK, France, The Netherlands, Italy, Spain, Brazil, Argentina, Chile, UAE, Saudi Arabia, South Africa, Egypt and Turkey
Competitive landscape Leading Companies, Market Positioning of Companies, Competitive Strategies, and Industry Risks

Request Free Sample

Research Analyst Overview

  • From an analyst perspective, the AI hallucination detection and mitigation tools market is maturing from a reactive, problem-fixing posture to a strategic, proactive governance framework. The core of this shift lies in embedding model observability platforms and real-time monitoring directly into the AI development lifecycle.
  • This allows for continuous data quality assurance and immediate intervention, which is a boardroom-level imperative as AI becomes central to business strategy. We see a clear trend where investment in model validation tools is no longer a discretionary IT budget item but a fundamental component of model risk management.
  • Enterprises that have implemented comprehensive AI governance platforms report a 40% reduction in escalations related to inaccurate AI-generated content. The focus on explainable AI (XAI) and rigorous bias detection is driven by the need to not only trust AI outputs but also to defend them under regulatory scrutiny.
  • The market's evolution is directly tied to this demand for transparent, auditable, and reliable AI.

What are the Key Data Covered in this AI Hallucination Detection And Mitigation Tools Market Research and Growth Report?

  • What is the expected growth of the AI Hallucination Detection And Mitigation Tools Market between 2026 and 2030?

    • USD 4.35 billion, at a CAGR of 32.9%

  • What segmentation does the market report cover?

    • The report is segmented by Component (Software, and Services), Deployment (Cloud, and On-premises), Business Segment (Large enterprises, and Small and medium enterprises) and Geography (North America, APAC, Europe, South America, Middle East and Africa)

  • Which regions are analyzed in the report?

    • North America, APAC, Europe, South America and Middle East and Africa

  • What are the key growth drivers and market challenges?

    • Escalating demand for reliable AI in mission critical sectors, High computational costs and resource intensiveness of mitigation algorithms

  • Who are the major players in the AI Hallucination Detection And Mitigation Tools Market?

    • Amazon.com Inc., Arize AI Inc., ArthurAI Inc., Cleanlab Inc, Deepchecks AI, Evidently AI, Fiddler AI, Galileo, Giskard AI, Google LLC, HoneyHive, Lakera Inc, LangChain Inc., Lasso Security Ltd., Microsoft Corp., NVIDIA Corp., Patronus AI Inc., Vectara Inc., Weights and Biases Inc. and WhyLabs, Inc.

Market Research Insights

  • The market's trajectory is defined by the rapid evolution of digital transformation initiatives and the corresponding need for robust AI-powered data validation. As businesses integrate AI into enterprise resource planning systems and customer relationship management (CRM) platforms, ensuring enterprise-grade AI security is crucial. Adoption of these tools has led to a 40% improvement in data accuracy for some firms.
  • The use of AI-driven threat intelligence helps fortify the AI security stack, with organizations reporting a 25% faster response to potential data exfiltration attempts. This focus on security and reliability is essential as AI applications expand across the cloud computing infrastructure, underpinning the growth of the entire ecosystem.

We can help! Our analysts can customize this ai hallucination detection and mitigation tools market research report to meet your requirements.

Get in touch

1. Executive Summary

1.1 Market overview

Executive Summary - Chart on Market Overview
Executive Summary - Data Table on Market Overview
Executive Summary - Chart on Global Market Characteristics
Executive Summary - Chart on Market by Geography
Executive Summary - Chart on Market Segmentation by Component
Executive Summary - Chart on Market Segmentation by Deployment
Executive Summary - Chart on Market Segmentation by Business Segment
Executive Summary - Chart on Incremental Growth
Executive Summary - Data Table on Incremental Growth
Executive Summary - Chart on Company Market Positioning

2. Technavio Analysis

2.1 Analysis of price sensitivity, lifecycle, customer purchase basket, adoption rates, and purchase criteria

2.2 Criticality of inputs and Factors of differentiation

Chart on Overview on criticality of inputs and factors of differentiation

2.3 Factors of disruption

Chart on Overview on factors of disruption

2.4 Impact of drivers and challenges

Chart on Impact of drivers and challenges in 2025 and 2030

3. Market Landscape

3.1 Market ecosystem

Chart on Parent Market
Data Table on - Parent Market

3.2 Market characteristics

Chart on Market characteristics analysis

3.3 Value chain analysis

Chart on Value chain analysis

4. Market Sizing

4.1 Market definition

Data Table on Offerings of companies included in the market definition

4.2 Market segment analysis

Market segments

4.3 Market size 2025

4.4 Market outlook: Forecast for 2025-2030

Chart on Global - Market size and forecast 2025-2030 ($ million)
Data Table on Global - Market size and forecast 2025-2030 ($ million)
Chart on Global Market: Year-over-year growth 2025-2030 (%)
Data Table on Global Market: Year-over-year growth 2025-2030 (%)

5. Historic Market Size

5.1 Global AI Hallucination Detection And Mitigation Tools Market 2020 - 2024

Historic Market Size - Data Table on Global AI Hallucination Detection And Mitigation Tools Market 2020 - 2024 ($ million)

5.2 Component segment analysis 2020 - 2024

Historic Market Size - Component Segment 2020 - 2024 ($ million)

5.3 Deployment segment analysis 2020 - 2024

Historic Market Size - Deployment Segment 2020 - 2024 ($ million)

5.4 Business segment analysis 2020 - 2024

Historic Market Size - Business Segment 2020 - 2024 ($ million)

5.5 Geography segment analysis 2020 - 2024

Historic Market Size - Geography Segment 2020 - 2024 ($ million)

5.6 Country segment analysis 2020 - 2024

Historic Market Size - Country Segment 2020 - 2024 ($ million)

6. Qualitative Analysis

6.1 Impact of Geopolitical Conflicts Global AI Hallucination Detection and Mitigation Tools Market

7. Five Forces Analysis

7.1 Five forces summary

Five forces analysis - Comparison between 2025 and 2030

7.2 Bargaining power of buyers

Bargaining power of buyers - Impact of key factors 2025 and 2030

7.3 Bargaining power of suppliers

Bargaining power of suppliers - Impact of key factors in 2025 and 2030

7.4 Threat of new entrants

Threat of new entrants - Impact of key factors in 2025 and 2030

7.5 Threat of substitutes

Threat of substitutes - Impact of key factors in 2025 and 2030

7.6 Threat of rivalry

Threat of rivalry - Impact of key factors in 2025 and 2030

7.7 Market condition

Chart on Market condition - Five forces 2025 and 2030

8. Market Segmentation by Component

8.1 Market segments

Chart on Component - Market share 2025-2030 (%)
Data Table on Component - Market share 2025-2030 (%)

8.2 Comparison by Component

Chart on Comparison by Component
Data Table on Comparison by Component

8.3 Software - Market size and forecast 2025-2030

Chart on Software - Market size and forecast 2025-2030 ($ million)
Data Table on Software - Market size and forecast 2025-2030 ($ million)
Chart on Software - Year-over-year growth 2025-2030 (%)
Data Table on Software - Year-over-year growth 2025-2030 (%)

8.4 Services - Market size and forecast 2025-2030

Chart on Services - Market size and forecast 2025-2030 ($ million)
Data Table on Services - Market size and forecast 2025-2030 ($ million)
Chart on Services - Year-over-year growth 2025-2030 (%)
Data Table on Services - Year-over-year growth 2025-2030 (%)

8.5 Market opportunity by Component

Market opportunity by Component ($ million)
Data Table on Market opportunity by Component ($ million)

9. Market Segmentation by Deployment

9.1 Market segments

Chart on Deployment - Market share 2025-2030 (%)
Data Table on Deployment - Market share 2025-2030 (%)

9.2 Comparison by Deployment

Chart on Comparison by Deployment
Data Table on Comparison by Deployment

9.3 Cloud - Market size and forecast 2025-2030

Chart on Cloud - Market size and forecast 2025-2030 ($ million)
Data Table on Cloud - Market size and forecast 2025-2030 ($ million)
Chart on Cloud - Year-over-year growth 2025-2030 (%)
Data Table on Cloud - Year-over-year growth 2025-2030 (%)

9.4 On-premises - Market size and forecast 2025-2030

Chart on On-premises - Market size and forecast 2025-2030 ($ million)
Data Table on On-premises - Market size and forecast 2025-2030 ($ million)
Chart on On-premises - Year-over-year growth 2025-2030 (%)
Data Table on On-premises - Year-over-year growth 2025-2030 (%)

9.5 Market opportunity by Deployment

Market opportunity by Deployment ($ million)
Data Table on Market opportunity by Deployment ($ million)

10. Market Segmentation by Business Segment

10.1 Market segments

Chart on Market Segmentation by Business Segment - Market share 2025-2030 (%)
Data Table on Market Segmentation by Business Segment - Market share 2025-2030 (%)

10.2 Comparison by Market Segmentation by Business Segment

Chart on Comparison by Market Segmentation by Business Segment
Data Table on Comparison by Market Segmentation by Business Segment

10.3 Large enterprises - Market size and forecast 2025-2030

Chart on Large enterprises - Market size and forecast 2025-2030 ($ million)
Data Table on Large enterprises - Market size and forecast 2025-2030 ($ million)
Chart on Large enterprises - Year-over-year growth 2025-2030 (%)
Data Table on Large enterprises - Year-over-year growth 2025-2030 (%)

10.4 Small and medium enterprises - Market size and forecast 2025-2030

Chart on Small and medium enterprises - Market size and forecast 2025-2030 ($ million)
Data Table on Small and medium enterprises - Market size and forecast 2025-2030 ($ million)
Chart on Small and medium enterprises - Year-over-year growth 2025-2030 (%)
Data Table on Small and medium enterprises - Year-over-year growth 2025-2030 (%)

10.5 Market opportunity by Market Segmentation by Business Segment

Market opportunity by Market Segmentation by Business Segment ($ million)
Data Table on Market opportunity by Market Segmentation by Business Segment ($ million)

11. Customer Landscape

11.1 Customer landscape overview

Analysis of price sensitivity, lifecycle, customer purchase basket, adoption rates, and purchase criteria

12. Geographic Landscape

12.1 Geographic segmentation

Chart on Market share by geography 2025-2030 (%)
Data Table on Market share by geography 2025-2030 (%)

12.2 Geographic comparison

Chart on Geographic comparison
Data Table on Geographic comparison

12.3 North America - Market size and forecast 2025-2030

Chart on North America - Market size and forecast 2025-2030 ($ million)
Data Table on North America - Market size and forecast 2025-2030 ($ million)
Chart on North America - Year-over-year growth 2025-2030 (%)
Data Table on North America - Year-over-year growth 2025-2030 (%)
Chart on Regional Comparison - North America
Data Table on Regional Comparison - North America

12.3.1 US - Market size and forecast 2025-2030

Chart on US - Market size and forecast 2025-2030 ($ million)
Data Table on US - Market size and forecast 2025-2030 ($ million)
Chart on US - Year-over-year growth 2025-2030 (%)
Data Table on US - Year-over-year growth 2025-2030 (%)

12.3.2 Canada - Market size and forecast 2025-2030

Chart on Canada - Market size and forecast 2025-2030 ($ million)
Data Table on Canada - Market size and forecast 2025-2030 ($ million)
Chart on Canada - Year-over-year growth 2025-2030 (%)
Data Table on Canada - Year-over-year growth 2025-2030 (%)

12.3.3 Mexico - Market size and forecast 2025-2030

Chart on Mexico - Market size and forecast 2025-2030 ($ million)
Data Table on Mexico - Market size and forecast 2025-2030 ($ million)
Chart on Mexico - Year-over-year growth 2025-2030 (%)
Data Table on Mexico - Year-over-year growth 2025-2030 (%)

12.4 APAC - Market size and forecast 2025-2030

Chart on APAC - Market size and forecast 2025-2030 ($ million)
Data Table on APAC - Market size and forecast 2025-2030 ($ million)
Chart on APAC - Year-over-year growth 2025-2030 (%)
Data Table on APAC - Year-over-year growth 2025-2030 (%)
Chart on Regional Comparison - APAC
Data Table on Regional Comparison - APAC

12.4.1 China - Market size and forecast 2025-2030

Chart on China - Market size and forecast 2025-2030 ($ million)
Data Table on China - Market size and forecast 2025-2030 ($ million)
Chart on China - Year-over-year growth 2025-2030 (%)
Data Table on China - Year-over-year growth 2025-2030 (%)

12.4.2 India - Market size and forecast 2025-2030

Chart on India - Market size and forecast 2025-2030 ($ million)
Data Table on India - Market size and forecast 2025-2030 ($ million)
Chart on India - Year-over-year growth 2025-2030 (%)
Data Table on India - Year-over-year growth 2025-2030 (%)

12.4.3 Japan - Market size and forecast 2025-2030

Chart on Japan - Market size and forecast 2025-2030 ($ million)
Data Table on Japan - Market size and forecast 2025-2030 ($ million)
Chart on Japan - Year-over-year growth 2025-2030 (%)
Data Table on Japan - Year-over-year growth 2025-2030 (%)

12.4.4 South Korea - Market size and forecast 2025-2030

Chart on South Korea - Market size and forecast 2025-2030 ($ million)
Data Table on South Korea - Market size and forecast 2025-2030 ($ million)
Chart on South Korea - Year-over-year growth 2025-2030 (%)
Data Table on South Korea - Year-over-year growth 2025-2030 (%)

12.4.5 Australia - Market size and forecast 2025-2030

Chart on Australia - Market size and forecast 2025-2030 ($ million)
Data Table on Australia - Market size and forecast 2025-2030 ($ million)
Chart on Australia - Year-over-year growth 2025-2030 (%)
Data Table on Australia - Year-over-year growth 2025-2030 (%)

12.4.6 Indonesia - Market size and forecast 2025-2030

Chart on Indonesia - Market size and forecast 2025-2030 ($ million)
Data Table on Indonesia - Market size and forecast 2025-2030 ($ million)
Chart on Indonesia - Year-over-year growth 2025-2030 (%)
Data Table on Indonesia - Year-over-year growth 2025-2030 (%)

12.5 Europe - Market size and forecast 2025-2030

Chart on Europe - Market size and forecast 2025-2030 ($ million)
Data Table on Europe - Market size and forecast 2025-2030 ($ million)
Chart on Europe - Year-over-year growth 2025-2030 (%)
Data Table on Europe - Year-over-year growth 2025-2030 (%)
Chart on Regional Comparison - Europe
Data Table on Regional Comparison - Europe

12.5.1 Germany - Market size and forecast 2025-2030

Chart on Germany - Market size and forecast 2025-2030 ($ million)
Data Table on Germany - Market size and forecast 2025-2030 ($ million)
Chart on Germany - Year-over-year growth 2025-2030 (%)
Data Table on Germany - Year-over-year growth 2025-2030 (%)

12.5.2 UK - Market size and forecast 2025-2030

Chart on UK - Market size and forecast 2025-2030 ($ million)
Data Table on UK - Market size and forecast 2025-2030 ($ million)
Chart on UK - Year-over-year growth 2025-2030 (%)
Data Table on UK - Year-over-year growth 2025-2030 (%)

12.5.3 France - Market size and forecast 2025-2030

Chart on France - Market size and forecast 2025-2030 ($ million)
Data Table on France - Market size and forecast 2025-2030 ($ million)
Chart on France - Year-over-year growth 2025-2030 (%)
Data Table on France - Year-over-year growth 2025-2030 (%)

12.5.4 The Netherlands - Market size and forecast 2025-2030

Chart on The Netherlands - Market size and forecast 2025-2030 ($ million)
Data Table on The Netherlands - Market size and forecast 2025-2030 ($ million)
Chart on The Netherlands - Year-over-year growth 2025-2030 (%)
Data Table on The Netherlands - Year-over-year growth 2025-2030 (%)

12.5.5 Italy - Market size and forecast 2025-2030

Chart on Italy - Market size and forecast 2025-2030 ($ million)
Data Table on Italy - Market size and forecast 2025-2030 ($ million)
Chart on Italy - Year-over-year growth 2025-2030 (%)
Data Table on Italy - Year-over-year growth 2025-2030 (%)

12.5.6 Spain - Market size and forecast 2025-2030

Chart on Spain - Market size and forecast 2025-2030 ($ million)
Data Table on Spain - Market size and forecast 2025-2030 ($ million)
Chart on Spain - Year-over-year growth 2025-2030 (%)
Data Table on Spain - Year-over-year growth 2025-2030 (%)

12.6 South America - Market size and forecast 2025-2030

Chart on South America - Market size and forecast 2025-2030 ($ million)
Data Table on South America - Market size and forecast 2025-2030 ($ million)
Chart on South America - Year-over-year growth 2025-2030 (%)
Data Table on South America - Year-over-year growth 2025-2030 (%)
Chart on Regional Comparison - South America
Data Table on Regional Comparison - South America

12.6.1 Brazil - Market size and forecast 2025-2030

Chart on Brazil - Market size and forecast 2025-2030 ($ million)
Data Table on Brazil - Market size and forecast 2025-2030 ($ million)
Chart on Brazil - Year-over-year growth 2025-2030 (%)
Data Table on Brazil - Year-over-year growth 2025-2030 (%)

12.6.2 Argentina - Market size and forecast 2025-2030

Chart on Argentina - Market size and forecast 2025-2030 ($ million)
Data Table on Argentina - Market size and forecast 2025-2030 ($ million)
Chart on Argentina - Year-over-year growth 2025-2030 (%)
Data Table on Argentina - Year-over-year growth 2025-2030 (%)

12.6.3 Chile - Market size and forecast 2025-2030

Chart on Chile - Market size and forecast 2025-2030 ($ million)
Data Table on Chile - Market size and forecast 2025-2030 ($ million)
Chart on Chile - Year-over-year growth 2025-2030 (%)
Data Table on Chile - Year-over-year growth 2025-2030 (%)

12.7 Middle East and Africa - Market size and forecast 2025-2030

Chart on Middle East and Africa - Market size and forecast 2025-2030 ($ million)
Data Table on Middle East and Africa - Market size and forecast 2025-2030 ($ million)
Chart on Middle East and Africa - Year-over-year growth 2025-2030 (%)
Data Table on Middle East and Africa - Year-over-year growth 2025-2030 (%)
Chart on Regional Comparison - Middle East and Africa
Data Table on Regional Comparison - Middle East and Africa

12.7.1 UAE - Market size and forecast 2025-2030

Chart on UAE - Market size and forecast 2025-2030 ($ million)
Data Table on UAE - Market size and forecast 2025-2030 ($ million)
Chart on UAE - Year-over-year growth 2025-2030 (%)
Data Table on UAE - Year-over-year growth 2025-2030 (%)

12.7.2 Saudi Arabia - Market size and forecast 2025-2030

Chart on Saudi Arabia - Market size and forecast 2025-2030 ($ million)
Data Table on Saudi Arabia - Market size and forecast 2025-2030 ($ million)
Chart on Saudi Arabia - Year-over-year growth 2025-2030 (%)
Data Table on Saudi Arabia - Year-over-year growth 2025-2030 (%)

12.7.3 South Africa - Market size and forecast 2025-2030

Chart on South Africa - Market size and forecast 2025-2030 ($ million)
Data Table on South Africa - Market size and forecast 2025-2030 ($ million)
Chart on South Africa - Year-over-year growth 2025-2030 (%)
Data Table on South Africa - Year-over-year growth 2025-2030 (%)

12.7.4 Egypt - Market size and forecast 2025-2030

Chart on Egypt - Market size and forecast 2025-2030 ($ million)
Data Table on Egypt - Market size and forecast 2025-2030 ($ million)
Chart on Egypt - Year-over-year growth 2025-2030 (%)
Data Table on Egypt - Year-over-year growth 2025-2030 (%)

12.7.5 Turkey - Market size and forecast 2025-2030

Chart on Turkey - Market size and forecast 2025-2030 ($ million)
Data Table on Turkey - Market size and forecast 2025-2030 ($ million)
Chart on Turkey - Year-over-year growth 2025-2030 (%)
Data Table on Turkey - Year-over-year growth 2025-2030 (%)

12.8 Market opportunity by geography

Market opportunity by geography ($ million)
Data Tables on Market opportunity by geography ($ million)

13. Drivers, Challenges, and Opportunity

13.1 Market drivers

Escalating demand for reliable AI in mission critical sectors
Stringent regulatory frameworks and compliance mandates governing AI operations
Rapid expansion of generative AI across enterprise workflows

13.2 Market challenges

High computational costs and resource intensiveness of mitigation algorithms
Complexity of evolving AI architectures and dynamic output variables
Lack of standardized metrics for evaluating hallucination severity

13.3 Impact of drivers and challenges

Impact of drivers and challenges in 2025 and 2030

13.4 Market opportunities

Integration of multi-agent cross-verification systems for enhanced accuracy
Emergence of domain specific knowledge graph anchoring techniques
Transition toward edge computing and localized hallucination detection

14. Competitive Landscape

14.1 Overview

14.2

Overview on criticality of inputs and factors of differentiation

14.3 Landscape disruption

Overview on factors of disruption

14.4 Industry risks

Impact of key risks on business

15. Competitive Analysis

15.1 Companies profiled

Companies covered

15.2 Company ranking index

15.3 Market positioning of companies

Matrix on companies position and classification

15.4 Amazon.com Inc.

Amazon.com Inc. - Overview
Amazon.com Inc. - Business segments
Amazon.com Inc. - Key news
Amazon.com Inc. - Key offerings
Amazon.com Inc. - Segment focus
SWOT

15.5 Arize AI Inc.

Arize AI Inc. - Overview
Arize AI Inc. - Product / Service
Arize AI Inc. - Key offerings
SWOT

15.6 ArthurAI Inc.

ArthurAI Inc. - Overview
ArthurAI Inc. - Product / Service
ArthurAI Inc. - Key offerings
SWOT

15.7 Cleanlab Inc

Cleanlab Inc - Overview
Cleanlab Inc - Product / Service
Cleanlab Inc - Key offerings
SWOT

15.8 Evidently AI

Evidently AI - Overview
Evidently AI - Product / Service
Evidently AI - Key offerings
SWOT

15.9 Fiddler AI

Fiddler AI - Overview
Fiddler AI - Product / Service
Fiddler AI - Key offerings
SWOT

15.10 Galileo

Galileo - Overview
Galileo - Product / Service
Galileo - Key offerings
SWOT

15.11 Giskard AI

Giskard AI - Overview
Giskard AI - Product / Service
Giskard AI - Key offerings
SWOT

15.12 Google LLC

Google LLC - Overview
Google LLC - Product / Service
Google LLC - Key offerings
SWOT

15.13 Microsoft Corp.

Microsoft Corp. - Overview
Microsoft Corp. - Business segments
Microsoft Corp. - Key news
Microsoft Corp. - Key offerings
Microsoft Corp. - Segment focus
SWOT

15.14 NVIDIA Corp.

NVIDIA Corp. - Overview
NVIDIA Corp. - Business segments
NVIDIA Corp. - Key news
NVIDIA Corp. - Key offerings
NVIDIA Corp. - Segment focus
SWOT

15.15 Patronus AI Inc.

Patronus AI Inc. - Overview
Patronus AI Inc. - Product / Service
Patronus AI Inc. - Key offerings
SWOT

15.16 Vectara Inc.

Vectara Inc. - Overview
Vectara Inc. - Product / Service
Vectara Inc. - Key offerings
SWOT

15.17 Weights and Biases Inc.

Weights and Biases Inc. - Overview
Weights and Biases Inc. - Product / Service
Weights and Biases Inc. - Key offerings
SWOT

15.18 WhyLabs, Inc.

WhyLabs, Inc. - Overview
WhyLabs, Inc. - Product / Service
WhyLabs, Inc. - Key offerings
SWOT

16. Appendix

16.1 Scope of the report

Market definition
Objectives
Notes and caveats

16.2 Inclusions and exclusions checklist

Inclusions checklist
Exclusions checklist

16.3 Currency conversion rates for US$

16.4 Research methodology

16.5 Data procurement

Information sources

16.6 Data validation

16.7 Validation techniques employed for market sizing

16.8 Data synthesis

16.9 360 degree market analysis

16.10 List of abbreviations

Research Methodology

Technavio presents a detailed picture of the market by way of study, synthesis, and summation of data from multiple sources. The analysts have presented the various facets of the market with a particular focus on identifying the key industry influencers. The data thus presented is comprehensive, reliable, and the result of extensive research, both primary and secondary.

INFORMATION SOURCES

Primary sources

  • Manufacturers and suppliers
  • Channel partners
  • Industry experts
  • Strategic decision makers

Secondary sources

  • Industry journals and periodicals
  • Government data
  • Financial reports of key industry players
  • Historical data
  • Press releases

DATA ANALYSIS

Data Synthesis

  • Collation of data
  • Estimation of key figures
  • Analysis of derived insights

Data Validation

  • Triangulation with data models
  • Reference against proprietary databases
  • Corroboration with industry experts

REPORT WRITING

Qualitative

  • Market drivers
  • Market challenges
  • Market trends
  • Five forces analysis

Quantitative

  • Market size and forecast
  • Market segmentation
  • Geographical insights
  • Competitive landscape

Interested in this report?

Get your sample now to see our research methodology and insights!

Download Now

Frequently Asked Questions

AI Hallucination Detection And Mitigation Tools market growth will increase by USD 4353.4 million during 2026-2030.

The AI Hallucination Detection And Mitigation Tools market is expected to grow at a CAGR of 32.9% during 2026-2030.

AI Hallucination Detection And Mitigation Tools market is segmented by Component (Software, Services) Deployment (Cloud, On-premises) Business segment (Large enterprises, Small and medium enterprises)

Amazon.com Inc., Arize AI Inc., ArthurAI Inc., Cleanlab Inc, Deepchecks AI, Evidently AI, Fiddler AI, Galileo, Giskard AI, Google LLC, HoneyHive, Lakera Inc, LangChain Inc., Lasso Security Ltd., Microsoft Corp., NVIDIA Corp., Patronus AI Inc., Vectara Inc., Weights and Biases Inc., WhyLabs, Inc. are a few of the key vendors in the AI Hallucination Detection And Mitigation Tools market.

North America will register the highest growth rate of 39.2% among the other regions. Therefore, the AI Hallucination Detection And Mitigation Tools market in North America is expected to garner significant business opportunities for the vendors during the forecast period.

US, Canada, Mexico, China, India, Japan, South Korea, Australia, Indonesia, Germany, UK, France, The Netherlands, Italy, Spain, Brazil, Argentina, Chile, UAE, Saudi Arabia, South Africa, Egypt, Turkey

  • Escalating demand for reliable AI in mission critical sectors is the driving factor this market.

The AI Hallucination Detection And Mitigation Tools market vendors should focus on grabbing business opportunities from the Component segment as it accounted for the largest market share in the base year.
RIA - Research AI Assistant
Ask RIA