
Advertising Services Market Analysis, Size, and Forecast 2026-2030: North America (US, Canada, and Mexico), APAC (China, Japan, and India), Europe (UK, Germany, and France), South America (Brazil, Argentina, and Chile), Middle East and Africa (Turkey, Saudi Arabia, and Israel), and Rest of World (ROW)

Advertising Services Market Analysis, Size, and Forecast 2026-2030:
North America (US, Canada, and Mexico), APAC (China, Japan, and India), Europe (UK, Germany, and France), South America (Brazil, Argentina, and Chile), Middle East and Africa (Turkey, Saudi Arabia, and Israel), and Rest of World (ROW)

Published: Nov 2026 307 Pages SKU: IRTNTR73436

Market Overview at a Glance

$177.92 B
Market Opportunity
4.5%
CAGR 2025 - 2030
38.9%
North America Growth
$353.44 B
Digital advertising segment 2024

Advertising Services Market Size 2026-2030

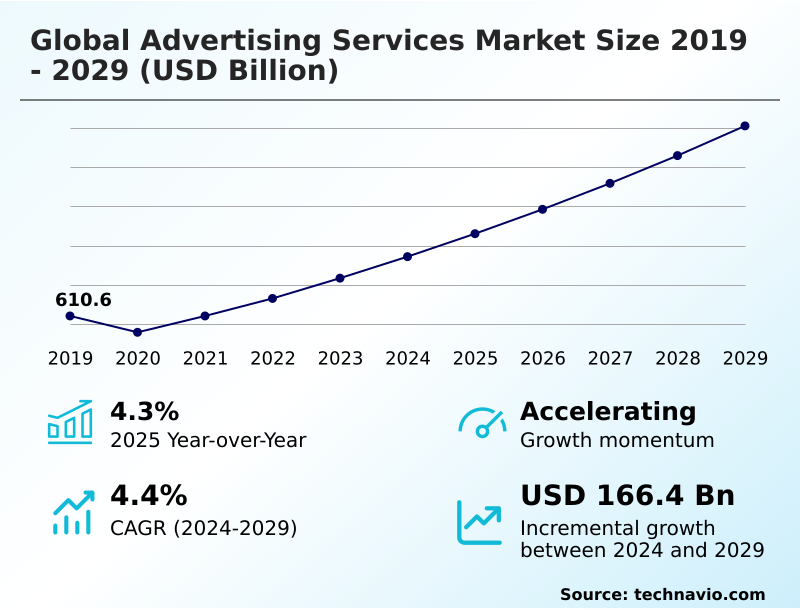
The advertising services market size is valued to increase by USD 177.92 billion, at a CAGR of 4.5% from 2025 to 2030. Pervasive integration of generative AI in creative production will drive the advertising services market.

Major Market Trends & Insights

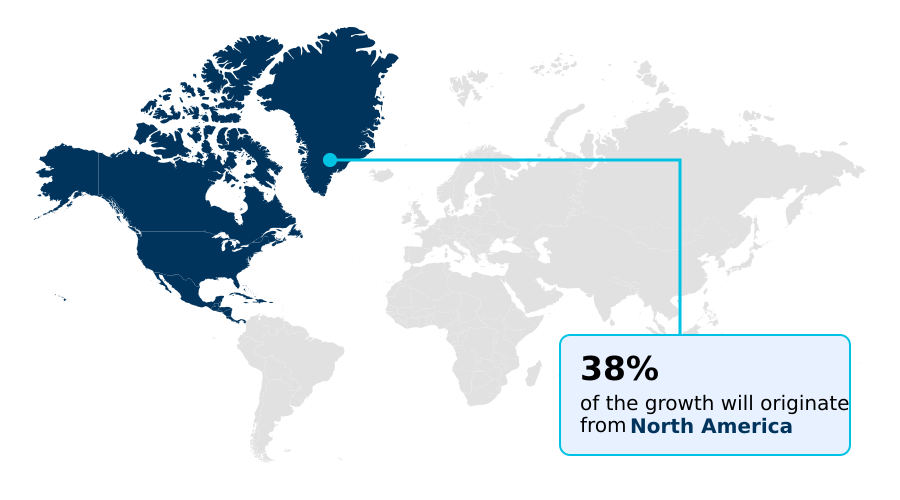
  • North America dominated the market and accounted for a 38.9% growth during the forecast period.
  • By Type - Digital advertising segment was valued at USD 353.44 billion in 2024
  • By Platform - Online advertising segment accounted for the largest market revenue share in 2024

Market Size & Forecast

  • Market Opportunities: USD 303.41 billion
  • Market Future Opportunities: USD 177.92 billion
  • CAGR from 2025 to 2030 : 4.5%

Market Summary

  • The structural evolution of the Advertising Services reflects a profound shift toward automated, data-driven brand communication and omnichannel campaign execution. A major technological driver propelling this industry is the rapid integration of artificial intelligence within media planning, allowing agencies to generate and optimize personalized digital ad variants in seconds.
  • In supply chain and retail operations, consumer packaged goods manufacturers leverage retail media networks to directly connect point-of-sale inventory data with targeted ad impressions, effectively reducing customer acquisition costs by 22% compared to traditional broadcast campaigns. However, the industry faces substantial operational friction due to the ongoing deprecation of third-party tracking cookies and fragmented regional data privacy regulations.
  • This regulatory pressure challenges media buyers to implement secure data clean rooms to maintain accurate attribution without exposing raw consumer data. As brands continuously demand high-performance marketing, advertising agencies are fundamentally re-engineering their tech stacks to balance hyper-targeted programmatic delivery with stringent compliance requirements. Ultimately, modern advertising strategies depend on unifying fragmented digital touchpoints into cohesive, privacy-preserving measurement models.

What will be the Size of the Advertising Services Market during the forecast period?
Get Key Insights on Market Forecast (PDF) Get Free Sample

How is the Advertising Services Market Segmented?

The advertising services industry research report provides comprehensive data (region-wise segment analysis), with forecasts and estimates in "USD million" for the period 2026-2030, as well as historical data from 2020-2024 for the following segments.

  • Type
    • Digital advertising
    • TV advertising
    • Print advertising
    • OOH advertising
    • Others
  • Platform
    • Online advertising
    • Offline advertising
  • End-user
    • Consumer goods and retail
    • IT and telecom
    • Government and public sector
    • BFSI
    • Others
  • Geography
    • North America
      • US
      • Canada
      • Mexico
    • APAC
      • China
      • Japan
      • India
      • Australia
      • South Korea
      • Indonesia
    • Europe
      • UK
      • Germany
      • France
      • Italy
      • Spain
      • The Netherlands
    • South America
      • Brazil
      • Argentina
      • Chile
    • Middle East and Africa
      • Turkey
      • Saudi Arabia
      • Israel
      • South Africa
      • UAE

By Type Insights

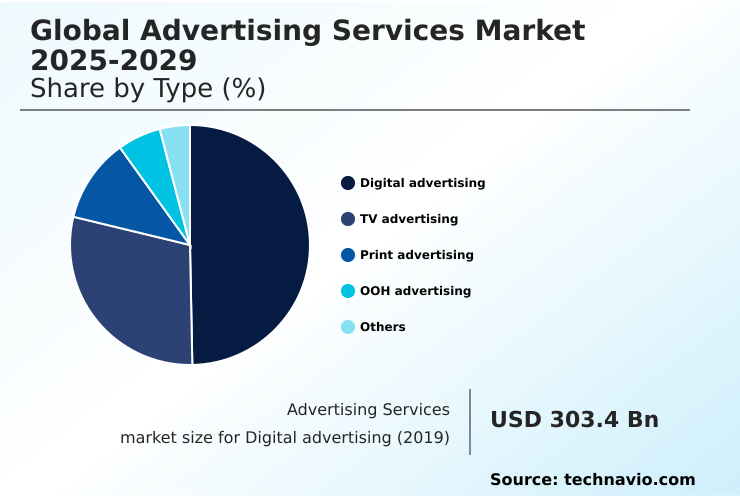
The digital advertising segment is estimated to witness significant growth during the forecast period.

The digital advertising segment of the Advertising Services ecosystem continuously evolves as enterprises shift away from legacy media toward precision-driven digital platforms. This transformation leverages advanced programmatic bidding workflows and real-time bidding algorithms to execute high-volume ad placements instantly.

By adopting dynamic creative optimization, brands can rapidly adjust messaging based on real-time consumer intent and demographic data. Implementing cross-screen frequency capping ensures that audiences are not oversaturated, improving overall campaign efficiency by 15%.

Furthermore, integrating interactive ad format design elevates user engagement within connected television and mobile environments.

This structural transition allows corporate marketing divisions to achieve granular audience targeting and measurable attribution, establishing digital channels as the primary infrastructure for modern brand communication and performance marketing execution.
Get Free Sample

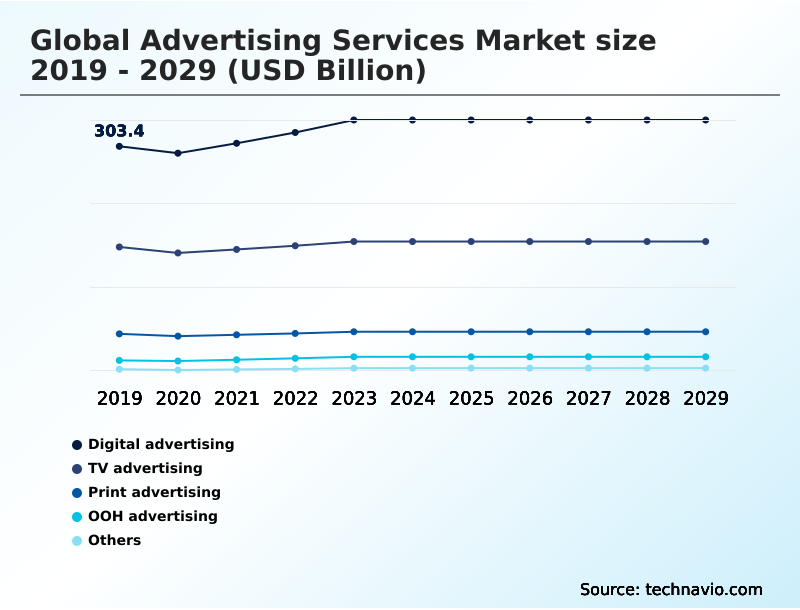
The Digital advertising segment was valued at USD 353.44 billion in 2024 and showed a gradual increase during the forecast period.
Get Free Sample

Regional Analysis

North America is estimated to contribute 38.9% to the growth of the global market during the forecast period.Technavio’s analysts have elaborately explained the regional trends and drivers that shape the market during the forecast period.
See How Advertising Services Market Demand is Rising in North America Get Free Sample

The geographic landscape of the Advertising Services reveals distinct adoption patterns across diverse regional economies.

North America demonstrates a commanding technological advantage, where the widespread integration of programmatic demand-side platforms has enhanced digital media buying efficiency by 28% over traditional procurement methods.

In contrast, the APAC region exhibits explosive growth fueled by mobile-first consumer behavior, leading to a 35% higher adoption rate of location-based mobile measurement systems compared to European markets.

Businesses in Europe adapt their strategies by strictly deploying privacy-compliant omnichannel media planning to navigate robust regulatory frameworks. Meanwhile, North American agencies heavily utilize advanced audience household mapping to optimize connected television placements, successfully reducing ad spend waste by 18%.

Furthermore, continuous investments in multilingual search engine optimization across APAC allow regional brands to capture rapidly expanding e-commerce audiences, reflecting deeply localized approaches to automated digital marketing execution.

Market Dynamics

Our researchers analyzed the data with 2025 as the base year, along with the key drivers, trends, and challenges. A holistic analysis of drivers will help companies refine their marketing strategies to gain a competitive advantage.

  • The transformation of the Advertising Services landscape highlights an urgent corporate mandate to integrate sophisticated data analytics directly into global marketing operations. As enterprises strive to maximize return on ad spend across fragmented digital channels, the adoption of generative artificial intelligence workflow automation has become essential for scaling personalized creative production without proportional increases in overhead costs.
  • Concurrently, major consumer packaged goods brands are reallocating supply chain marketing budgets toward closed loop commerce media platforms, enabling them to map digital ad impressions directly to verified retail point-of-sale transactions. This operational shift provides approximately a 20% faster pipeline from product discovery to final purchase when compared to legacy indirect marketing models.
  • Furthermore, as traditional broadcast viewership declines, media planners are accelerating investments in programmatic bidding connected tv campaigns to target premium audiences with dynamic, localized video content. To address the severe disruptions caused by global data protection regulations and cookie deprecation, agencies are actively migrating their infrastructure toward robust privacy compliant identity management frameworks.
  • This compliance-driven transition ensures secure first-party data collaboration while maintaining accurate cross-platform attribution. Additionally, the industry is transitioning away from standard viewability metrics, increasingly relying on biometric eye tracking attention metrics to scientifically validate genuine consumer engagement, ultimately driving superior commercial performance and optimized inventory procurement.
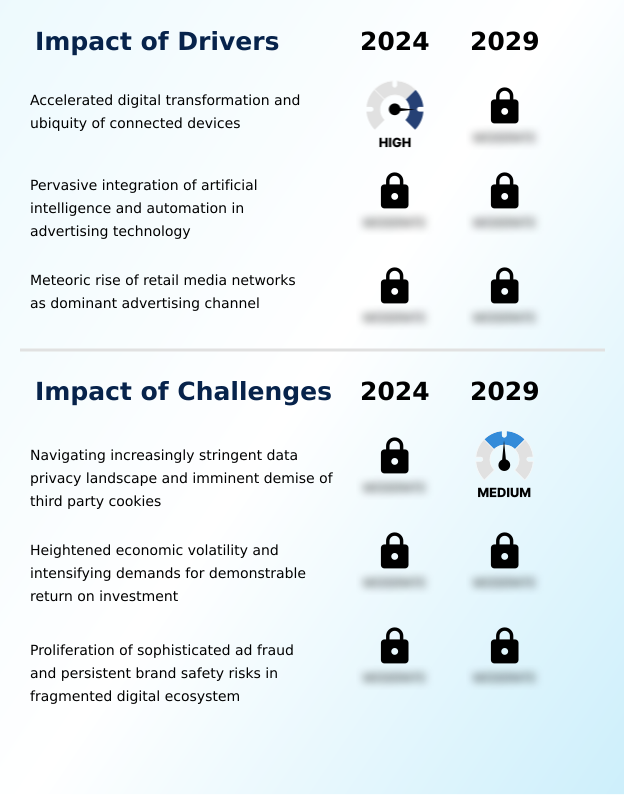
What are the key market drivers leading to the rise in the adoption of Advertising Services Industry?

  • The pervasive integration of generative artificial intelligence into creative production workflows serves as a primary technological driver, drastically accelerating campaign launch timelines and enabling hyper-personalized messaging at scale.

  • The Advertising Services sector is propelled by the explosive convergence of digital commerce and interactive media consumption. Because consumers demand immediate purchasing gratification within content streams, brands are aggressively deploying shoppable video formats across connected platforms.
  • This shift enables retail enterprises to activate first-party point-of-sale data to create highly targeted ad experiences. By integrating frictionless native checkout mechanisms into social feeds, companies shorten the purchase journey, accelerating direct sales conversions by 28%.
  • Furthermore, utilizing hyper-personalized video ad variants allows creative agencies to dynamically adapt messaging to specific demographic triggers.
  • The continuous deployment of shoppable social media placements drastically enhances return on ad spend, cutting customer acquisition costs by 15% and driving sustained commercial expansion across retail networks.

What are the market trends shaping the Advertising Services Industry?

  • The commercial transition toward first-party data clean rooms and unified identification frameworks represents a defining trend within the industry. This structural shift enables advertisers to maintain precise audience targeting while adhering to increasingly strict global privacy compliance standards.

  • The Advertising Services landscape is undergoing a structural shift driven by the rapid commercial migration from standard viewability to sophisticated engagement metrics. Because legacy tracking fails to prove actual consumer focus, agencies are increasingly adopting biometric eye-tracking data to scientifically score media inventory.
  • This transition allows brands to execute attention-optimized media buying, which has improved overall campaign engagement rates by 22% compared to traditional open-exchange bidding. Concurrently, the explosive growth of social commerce has compelled businesses to internalize creator economy management within core operations.
  • By deploying automated influencer matching algorithms, enterprises have reduced partnership discovery times by over 40%, accelerating the deployment of highly authentic digital endorsements. To safeguard these multi-channel operations against escalating privacy constraints, brands are implementing decentralized data clean rooms, securing cross-platform analytics while ensuring absolute data compliance.

What challenges does the Advertising Services Industry face during its growth?

  • The widespread deprecation of third-party tracking cookies and the associated strain of global data privacy compliance pose significant structural challenges, forcing agencies to heavily invest in alternative measurement and attribution frameworks.

  • The Advertising Services industry encounters severe operational friction from escalating digital ad fraud and the collapse of legacy tracking infrastructure. Because automated botnets artificially inflate programmatic impressions, agencies must continuously divert capital toward advanced fraud detection software and rigorous supply-path optimization frameworks to protect marketing budgets. This defensive requirement increases operational overhead costs by 18% for mid-tier media buyers.
  • Furthermore, the deprecation of cross-site identifiers fundamentally dismantles traditional multi-touch attribution models, leaving marketers struggling to prove precise return on ad spend. To counteract data loss, agencies increasingly pivot toward zero-party data capture and sophisticated contextual targeting solutions.
  • As economic volatility persists, clients aggressively demand performance-contingent remuneration models, successfully lowering their financial risk by 12% but significantly compressing profit margins for full-service advertising providers.

Exclusive Technavio Analysis on Customer Landscape

The advertising services market forecasting report includes the adoption lifecycle of the market, covering from the innovator’s stage to the laggard’s stage. It focuses on adoption rates in different regions based on penetration. Furthermore, the advertising services market report also includes key purchase criteria and drivers of price sensitivity to help companies evaluate and develop their market growth analysis strategies.
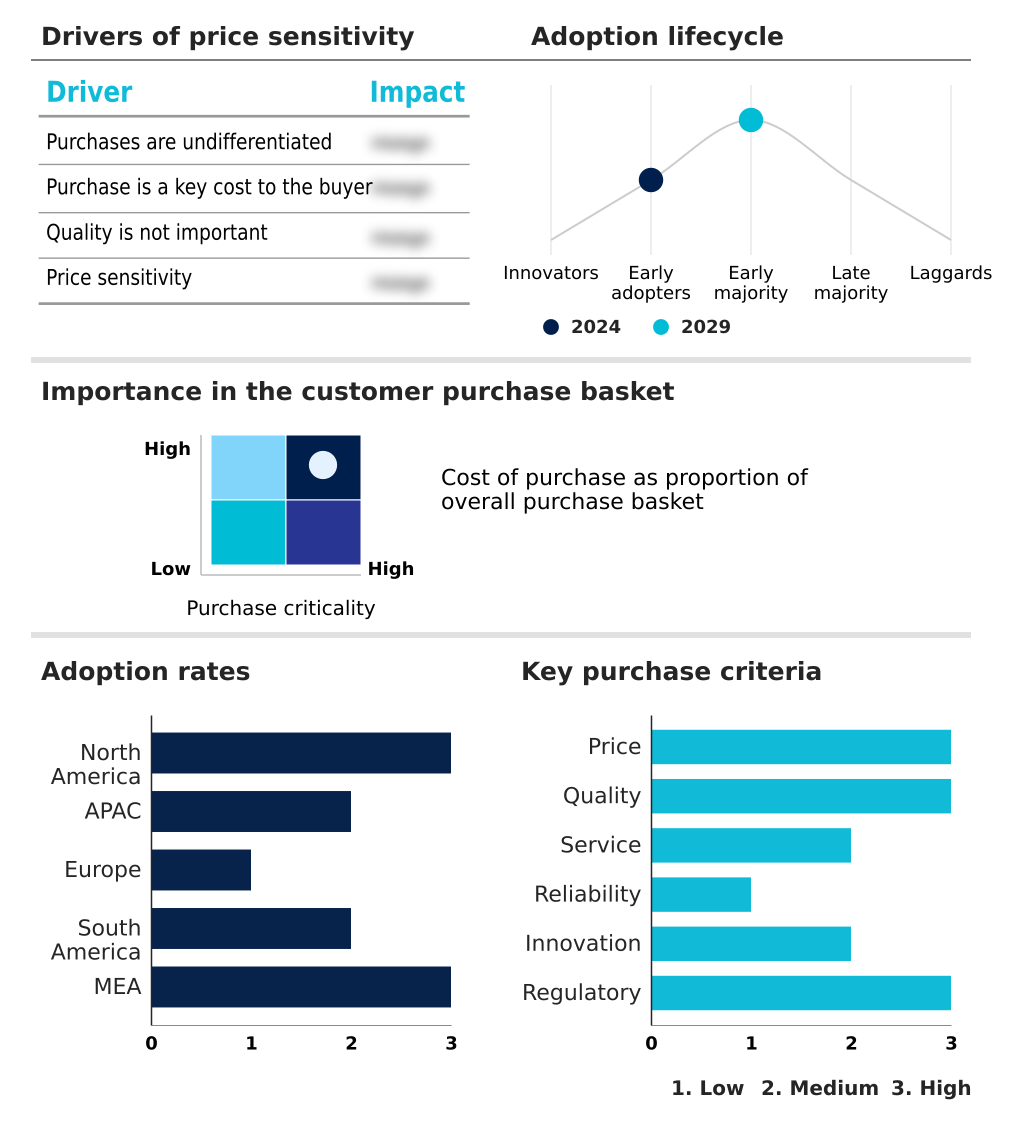
Customer Landscape of Advertising Services Industry

Competitive Landscape

Companies are implementing various strategies, such as strategic alliances, advertising services market forecast, partnerships, mergers and acquisitions, geographical expansion, and product/service launches, to enhance their presence in the industry.

Accenture Plc - Delivers comprehensive digital marketing solutions, integrating strategic media planning, precise ad buying, and targeted creative campaigns to maximize audience engagement and return on advertising spend globally.

The industry research and growth report includes detailed analyses of the competitive landscape of the market and information about key companies, including:

  • Accenture Plc
  • BlueFocus Intelligent
  • Cheil Worldwide Inc.
  • Dentsu Group Inc.
  • Dept Holding B.V.
  • Enero Group Ltd
  • Hakuhodo DY Holdings Inc.
  • Horizon Media LLC
  • Jellyfish Group Ltd
  • Omnicom Group Inc.
  • Plus Co Inc.
  • Publicis Groupe SA
  • RGA Media Group Inc.
  • S4Capital plc
  • Serviceplan Group SE and Co. KG
  • Stagwell Inc.
  • The Brandtech Group LLC
  • VaynerMedia LLC
  • Wieden Kennedy
  • WPP Plc

Qualitative and quantitative analysis of companies has been conducted to help clients understand the wider business environment as well as the strengths and weaknesses of key industry players. Data is qualitatively analyzed to categorize companies as pure play, category-focused, industry-focused, and diversified; it is quantitatively analyzed to categorize companies as dominant, leading, strong, tentative, and weak.

Recent Development and News in Advertising services market

  • In the Interactive Media and Services industry, the widespread adoption of open-source identity frameworks and first-party data architecture has fundamentally restructured user tracking, directly impacting Advertising Services demand by forcing agencies to deploy new privacy-preserving measurement alternatives that improve attribution accuracy by 12%.
  • The integration of shoppable video formats and closed-loop commerce media within leading social networking platforms has transformed consumer purchasing behaviors, expanding Advertising Services requirements as retail brands seek advanced native checkout mechanisms to drive instant digital conversions.
  • Stricter regulatory enforcement of cross-site identifier tracking across global mobile operating systems has degraded legacy audience targeting capabilities, compelling the Advertising Services sector to rapidly adopt privacy-compliant identity management protocols to maintain a 90% compliance rate across media campaigns.
  • The acceleration of digital out-of-home infrastructure and programmatic screen trading across urban transportation networks has unified physical and digital media ecosystems, driving Advertising Services adoption by enabling high-impact transit advertising synchronized with real-time location analytics.

Dive into Technavio’s robust research methodology, blending expert interviews, extensive data synthesis, and validated models for unparalleled Advertising Services Market insights. See full methodology.

Market Scope
Page number 307
Base year 2025
Historic period 2020-2024
Forecast period 2026-2030
Growth momentum & CAGR Accelerate at a CAGR of 4.5%
Market growth 2026-2030 USD 177920.5 million
Market structure Fragmented
YoY growth 2025-2026(%) 4.3%
Key countries US, Canada, Mexico, China, Japan, India, Australia, South Korea, Indonesia, UK, Germany, France, Italy, Spain, The Netherlands, Brazil, Argentina, Chile, Turkey, Saudi Arabia, Israel, South Africa and UAE
Competitive landscape Leading Companies, Market Positioning of Companies, Competitive Strategies, and Industry Risks

Request Free Sample

Research Analyst Overview

  • The continuous evolution of the Advertising Services sector fundamentally reshapes how multinational enterprises approach consumer acquisition, budget allocation, and strategic brand positioning. At the boardroom level, chief marketing officers are rapidly prioritizing investments in retail media networks to secure high-margin, point-of-purchase visibility, directly linking promotional expenditure to tangible product supply chain velocities.
  • To overcome stringent global data protection mandates, corporate strategists are accelerating the deployment of first-party data clean rooms and sophisticated cookie-less targeting mechanisms. This compliance-driven architecture ensures secure audience matching while maintaining regulatory alignment. Consequently, agencies utilizing unified identity resolution have achieved a 30% reduction in targeting discrepancies compared to traditional probabilistic models.
  • Furthermore, the integration of generative artificial intelligence empowers creative teams to execute hyper-personalized campaigns at unprecedented scales. Simultaneously, the rise of addressable television advertising enables precise, household-level messaging across digital living room environments. By leveraging predictive audience modeling, brands can dynamically reallocate media investments toward highest-converting demographics in real time.
  • These sophisticated technological integrations establish a resilient, highly accountable digital marketing infrastructure capable of sustaining long-term commercial performance.

What are the Key Data Covered in this Advertising Services Market Research and Growth Report?

  • What is the expected growth of the Advertising Services Market between 2026 and 2030?

    • USD 177.92 billion, at a CAGR of 4.5%

  • What segmentation does the market report cover?

    • The report is segmented by Type (Digital advertising, TV advertising, Print advertising, OOH advertising, and Others), Platform (Online advertising, and Offline advertising), End-user (Consumer goods and retail, IT and telecom, Government and public sector, BFSI, and Others) and Geography (North America, APAC, Europe, South America, Middle East and Africa)

  • Which regions are analyzed in the report?

    • North America, APAC, Europe, South America and Middle East and Africa

  • What are the key growth drivers and market challenges?

    • Pervasive integration of generative AI in creative production, Deprecation of third-party cookies and privacy compliance strain

  • Who are the major players in the Advertising Services Market?

    • Accenture Plc, BlueFocus Intelligent, Cheil Worldwide Inc., Dentsu Group Inc., Dept Holding B.V., Enero Group Ltd, Hakuhodo DY Holdings Inc., Horizon Media LLC, Jellyfish Group Ltd, Omnicom Group Inc., Plus Co Inc., Publicis Groupe SA, RGA Media Group Inc., S4Capital plc, Serviceplan Group SE and Co. KG, Stagwell Inc., The Brandtech Group LLC, VaynerMedia LLC, Wieden Kennedy and WPP Plc

Market Research Insights

  • The Advertising Services infrastructure is undergoing rapid modernization as enterprises prioritize omnichannel media planning and privacy-centric data ecosystems. By leveraging automated dynamic creative systems, marketing divisions have increased personalized ad delivery efficiency by 25% while simultaneously reducing manual production workflows.
  • Furthermore, the strategic activation of proprietary crm records within secure clean rooms allows brands to achieve a 18% improvement in customer retention rates compared to legacy targeting methods. As consumer discovery shifts toward social platforms, investments in creator economy management enable companies to drive authentic engagement, accelerating direct-to-consumer sales conversions by 14%.
  • These targeted performance metrics underscore a broader industry transition toward fully accountable, technology-enabled campaign execution across all media formats.

We can help! Our analysts can customize this advertising services market research report to meet your requirements.

Get in touch

1. Executive Summary

1.1 Market overview

Executive Summary - Chart on Market Overview
Executive Summary - Data Table on Market Overview
Executive Summary - Chart on Global Market Characteristics
Executive Summary - Chart on Market by Geography
Executive Summary - Chart on Market Segmentation by Type
Executive Summary - Chart on Market Segmentation by Platform
Executive Summary - Chart on Market Segmentation by End-user
Executive Summary - Chart on Incremental Growth
Executive Summary - Data Table on Incremental Growth
Executive Summary - Chart on Company Market Positioning

2. Technavio Analysis

2.1 Analysis of price sensitivity, lifecycle, customer purchase basket, adoption rates, and purchase criteria

2.2 Criticality of inputs and Factors of differentiation

Chart on Overview on criticality of inputs and factors of differentiation

2.3 Factors of disruption

Chart on Overview on factors of disruption

2.4 Impact of drivers and challenges

Chart on Impact of drivers and challenges in 2025 and 2030

3. Market Landscape

3.1 Market ecosystem

Chart on Parent Market
Data Table on - Parent Market

3.2 Market characteristics

Chart on Market characteristics analysis

3.3 Value chain analysis

Chart on Value chain analysis

4. Market Sizing

4.1 Market definition

Data Table on Offerings of companies included in the market definition

4.2 Market segment analysis

Market segments

4.3 Market size 2025

4.4 Market outlook: Forecast for 2025-2030

Chart on Global - Market size and forecast 2025-2030 ($ million)
Data Table on Global - Market size and forecast 2025-2030 ($ million)
Chart on Global Market: Year-over-year growth 2025-2030 (%)
Data Table on Global Market: Year-over-year growth 2025-2030 (%)

5. Historic Market Size

5.1 Global Advertising Services Market 2020 - 2024

Historic Market Size - Data Table on Global Advertising Services Market 2020 - 2024 ($ million)

5.2 Type segment analysis 2020 - 2024

Historic Market Size - Type Segment 2020 - 2024 ($ million)

5.3 Platform segment analysis 2020 - 2024

Historic Market Size - Platform Segment 2020 - 2024 ($ million)

5.4 End-user segment analysis 2020 - 2024

Historic Market Size - End-user Segment 2020 - 2024 ($ million)

5.5 Geography segment analysis 2020 - 2024

Historic Market Size - Geography Segment 2020 - 2024 ($ million)

5.6 Country segment analysis 2020 - 2024

Historic Market Size - Country Segment 2020 - 2024 ($ million)

6. Qualitative Analysis

6.1 Impact of AI on global advertising services market

6.2 Impact of geopolitical conflicts on global advertising services market

7. Five Forces Analysis

7.1 Five forces summary

Five forces analysis - Comparison between 2025 and 2030

7.2 Bargaining power of buyers

Bargaining power of buyers - Impact of key factors 2025 and 2030

7.3 Bargaining power of suppliers

Bargaining power of suppliers - Impact of key factors in 2025 and 2030

7.4 Threat of new entrants

Threat of new entrants - Impact of key factors in 2025 and 2030

7.5 Threat of substitutes

Threat of substitutes - Impact of key factors in 2025 and 2030

7.6 Threat of rivalry

Threat of rivalry - Impact of key factors in 2025 and 2030

7.7 Market condition

Chart on Market condition - Five forces 2025 and 2030

8. Market Segmentation by Type

8.1 Market segments

Chart on Type - Market share 2025-2030 (%)
Data Table on Type - Market share 2025-2030 (%)

8.2 Comparison by Type

Chart on Comparison by Type
Data Table on Comparison by Type

8.3 Digital advertising - Market size and forecast 2025-2030

Chart on Digital advertising - Market size and forecast 2025-2030 ($ million)
Data Table on Digital advertising - Market size and forecast 2025-2030 ($ million)
Chart on Digital advertising - Year-over-year growth 2025-2030 (%)
Data Table on Digital advertising - Year-over-year growth 2025-2030 (%)

8.4 TV advertising - Market size and forecast 2025-2030

Chart on TV advertising - Market size and forecast 2025-2030 ($ million)
Data Table on TV advertising - Market size and forecast 2025-2030 ($ million)
Chart on TV advertising - Year-over-year growth 2025-2030 (%)
Data Table on TV advertising - Year-over-year growth 2025-2030 (%)

8.5 Print advertising - Market size and forecast 2025-2030

Chart on Print advertising - Market size and forecast 2025-2030 ($ million)
Data Table on Print advertising - Market size and forecast 2025-2030 ($ million)
Chart on Print advertising - Year-over-year growth 2025-2030 (%)
Data Table on Print advertising - Year-over-year growth 2025-2030 (%)

8.6 OOH advertising - Market size and forecast 2025-2030

Chart on OOH advertising - Market size and forecast 2025-2030 ($ million)
Data Table on OOH advertising - Market size and forecast 2025-2030 ($ million)
Chart on OOH advertising - Year-over-year growth 2025-2030 (%)
Data Table on OOH advertising - Year-over-year growth 2025-2030 (%)

8.7 Others - Market size and forecast 2025-2030

Chart on Others - Market size and forecast 2025-2030 ($ million)
Data Table on Others - Market size and forecast 2025-2030 ($ million)
Chart on Others - Year-over-year growth 2025-2030 (%)
Data Table on Others - Year-over-year growth 2025-2030 (%)

8.8 Market opportunity by Type

Market opportunity by Type ($ million)
Data Table on Market opportunity by Type ($ million)

9. Market Segmentation by Platform

9.1 Market segments

Chart on Platform - Market share 2025-2030 (%)
Data Table on Platform - Market share 2025-2030 (%)

9.2 Comparison by Platform

Chart on Comparison by Platform
Data Table on Comparison by Platform

9.3 Online advertising - Market size and forecast 2025-2030

Chart on Online advertising - Market size and forecast 2025-2030 ($ million)
Data Table on Online advertising - Market size and forecast 2025-2030 ($ million)
Chart on Online advertising - Year-over-year growth 2025-2030 (%)
Data Table on Online advertising - Year-over-year growth 2025-2030 (%)

9.4 Offline advertising - Market size and forecast 2025-2030

Chart on Offline advertising - Market size and forecast 2025-2030 ($ million)
Data Table on Offline advertising - Market size and forecast 2025-2030 ($ million)
Chart on Offline advertising - Year-over-year growth 2025-2030 (%)
Data Table on Offline advertising - Year-over-year growth 2025-2030 (%)

9.5 Market opportunity by Platform

Market opportunity by Platform ($ million)
Data Table on Market opportunity by Platform ($ million)

10. Market Segmentation by End-user

10.1 Market segments

Chart on End-user - Market share 2025-2030 (%)
Data Table on End-user - Market share 2025-2030 (%)

10.2 Comparison by End-user

Chart on Comparison by End-user
Data Table on Comparison by End-user

10.3 Consumer goods and retail - Market size and forecast 2025-2030

Chart on Consumer goods and retail - Market size and forecast 2025-2030 ($ million)
Data Table on Consumer goods and retail - Market size and forecast 2025-2030 ($ million)
Chart on Consumer goods and retail - Year-over-year growth 2025-2030 (%)
Data Table on Consumer goods and retail - Year-over-year growth 2025-2030 (%)

10.4 IT and telecom - Market size and forecast 2025-2030

Chart on IT and telecom - Market size and forecast 2025-2030 ($ million)
Data Table on IT and telecom - Market size and forecast 2025-2030 ($ million)
Chart on IT and telecom - Year-over-year growth 2025-2030 (%)
Data Table on IT and telecom - Year-over-year growth 2025-2030 (%)

10.5 Government and public sector - Market size and forecast 2025-2030

Chart on Government and public sector - Market size and forecast 2025-2030 ($ million)
Data Table on Government and public sector - Market size and forecast 2025-2030 ($ million)
Chart on Government and public sector - Year-over-year growth 2025-2030 (%)
Data Table on Government and public sector - Year-over-year growth 2025-2030 (%)

10.6 BFSI - Market size and forecast 2025-2030

Chart on BFSI - Market size and forecast 2025-2030 ($ million)
Data Table on BFSI - Market size and forecast 2025-2030 ($ million)
Chart on BFSI - Year-over-year growth 2025-2030 (%)
Data Table on BFSI - Year-over-year growth 2025-2030 (%)

10.7 Others - Market size and forecast 2025-2030

Chart on Others - Market size and forecast 2025-2030 ($ million)
Data Table on Others - Market size and forecast 2025-2030 ($ million)
Chart on Others - Year-over-year growth 2025-2030 (%)
Data Table on Others - Year-over-year growth 2025-2030 (%)

10.8 Market opportunity by End-user

Market opportunity by End-user ($ million)
Data Table on Market opportunity by End-user ($ million)

11. Customer Landscape

11.1 Customer landscape overview

Analysis of price sensitivity, lifecycle, customer purchase basket, adoption rates, and purchase criteria

12. Geographic Landscape

12.1 Geographic segmentation

Chart on Market share by geography 2025-2030 (%)
Data Table on Market share by geography 2025-2030 (%)

12.2 Geographic comparison

Chart on Geographic comparison
Data Table on Geographic comparison

12.3 North America - Market size and forecast 2025-2030

Chart on North America - Market size and forecast 2025-2030 ($ million)
Data Table on North America - Market size and forecast 2025-2030 ($ million)
Chart on North America - Year-over-year growth 2025-2030 (%)
Data Table on North America - Year-over-year growth 2025-2030 (%)
Chart on Regional Comparison - North America
Data Table on Regional Comparison - North America

12.3.1 US - Market size and forecast 2025-2030

Chart on US - Market size and forecast 2025-2030 ($ million)
Data Table on US - Market size and forecast 2025-2030 ($ million)
Chart on US - Year-over-year growth 2025-2030 (%)
Data Table on US - Year-over-year growth 2025-2030 (%)

12.3.2 Canada - Market size and forecast 2025-2030

Chart on Canada - Market size and forecast 2025-2030 ($ million)
Data Table on Canada - Market size and forecast 2025-2030 ($ million)
Chart on Canada - Year-over-year growth 2025-2030 (%)
Data Table on Canada - Year-over-year growth 2025-2030 (%)

12.3.3 Mexico - Market size and forecast 2025-2030

Chart on Mexico - Market size and forecast 2025-2030 ($ million)
Data Table on Mexico - Market size and forecast 2025-2030 ($ million)
Chart on Mexico - Year-over-year growth 2025-2030 (%)
Data Table on Mexico - Year-over-year growth 2025-2030 (%)

12.4 APAC - Market size and forecast 2025-2030

Chart on APAC - Market size and forecast 2025-2030 ($ million)
Data Table on APAC - Market size and forecast 2025-2030 ($ million)
Chart on APAC - Year-over-year growth 2025-2030 (%)
Data Table on APAC - Year-over-year growth 2025-2030 (%)
Chart on Regional Comparison - APAC
Data Table on Regional Comparison - APAC

12.4.1 China - Market size and forecast 2025-2030

Chart on China - Market size and forecast 2025-2030 ($ million)
Data Table on China - Market size and forecast 2025-2030 ($ million)
Chart on China - Year-over-year growth 2025-2030 (%)
Data Table on China - Year-over-year growth 2025-2030 (%)

12.4.2 Japan - Market size and forecast 2025-2030

Chart on Japan - Market size and forecast 2025-2030 ($ million)
Data Table on Japan - Market size and forecast 2025-2030 ($ million)
Chart on Japan - Year-over-year growth 2025-2030 (%)
Data Table on Japan - Year-over-year growth 2025-2030 (%)

12.4.3 India - Market size and forecast 2025-2030

Chart on India - Market size and forecast 2025-2030 ($ million)
Data Table on India - Market size and forecast 2025-2030 ($ million)
Chart on India - Year-over-year growth 2025-2030 (%)
Data Table on India - Year-over-year growth 2025-2030 (%)

12.4.4 Australia - Market size and forecast 2025-2030

Chart on Australia - Market size and forecast 2025-2030 ($ million)
Data Table on Australia - Market size and forecast 2025-2030 ($ million)
Chart on Australia - Year-over-year growth 2025-2030 (%)
Data Table on Australia - Year-over-year growth 2025-2030 (%)

12.4.5 South Korea - Market size and forecast 2025-2030

Chart on South Korea - Market size and forecast 2025-2030 ($ million)
Data Table on South Korea - Market size and forecast 2025-2030 ($ million)
Chart on South Korea - Year-over-year growth 2025-2030 (%)
Data Table on South Korea - Year-over-year growth 2025-2030 (%)

12.4.6 Indonesia - Market size and forecast 2025-2030

Chart on Indonesia - Market size and forecast 2025-2030 ($ million)
Data Table on Indonesia - Market size and forecast 2025-2030 ($ million)
Chart on Indonesia - Year-over-year growth 2025-2030 (%)
Data Table on Indonesia - Year-over-year growth 2025-2030 (%)

12.5 Europe - Market size and forecast 2025-2030

Chart on Europe - Market size and forecast 2025-2030 ($ million)
Data Table on Europe - Market size and forecast 2025-2030 ($ million)
Chart on Europe - Year-over-year growth 2025-2030 (%)
Data Table on Europe - Year-over-year growth 2025-2030 (%)
Chart on Regional Comparison - Europe
Data Table on Regional Comparison - Europe

12.5.1 UK - Market size and forecast 2025-2030

Chart on UK - Market size and forecast 2025-2030 ($ million)
Data Table on UK - Market size and forecast 2025-2030 ($ million)
Chart on UK - Year-over-year growth 2025-2030 (%)
Data Table on UK - Year-over-year growth 2025-2030 (%)

12.5.2 Germany - Market size and forecast 2025-2030

Chart on Germany - Market size and forecast 2025-2030 ($ million)
Data Table on Germany - Market size and forecast 2025-2030 ($ million)
Chart on Germany - Year-over-year growth 2025-2030 (%)
Data Table on Germany - Year-over-year growth 2025-2030 (%)

12.5.3 France - Market size and forecast 2025-2030

Chart on France - Market size and forecast 2025-2030 ($ million)
Data Table on France - Market size and forecast 2025-2030 ($ million)
Chart on France - Year-over-year growth 2025-2030 (%)
Data Table on France - Year-over-year growth 2025-2030 (%)

12.5.4 Italy - Market size and forecast 2025-2030

Chart on Italy - Market size and forecast 2025-2030 ($ million)
Data Table on Italy - Market size and forecast 2025-2030 ($ million)
Chart on Italy - Year-over-year growth 2025-2030 (%)
Data Table on Italy - Year-over-year growth 2025-2030 (%)

12.5.5 Spain - Market size and forecast 2025-2030

Chart on Spain - Market size and forecast 2025-2030 ($ million)
Data Table on Spain - Market size and forecast 2025-2030 ($ million)
Chart on Spain - Year-over-year growth 2025-2030 (%)
Data Table on Spain - Year-over-year growth 2025-2030 (%)

12.5.6 The Netherlands - Market size and forecast 2025-2030

Chart on The Netherlands - Market size and forecast 2025-2030 ($ million)
Data Table on The Netherlands - Market size and forecast 2025-2030 ($ million)
Chart on The Netherlands - Year-over-year growth 2025-2030 (%)
Data Table on The Netherlands - Year-over-year growth 2025-2030 (%)

12.6 South America - Market size and forecast 2025-2030

Chart on South America - Market size and forecast 2025-2030 ($ million)
Data Table on South America - Market size and forecast 2025-2030 ($ million)
Chart on South America - Year-over-year growth 2025-2030 (%)
Data Table on South America - Year-over-year growth 2025-2030 (%)
Chart on Regional Comparison - South America
Data Table on Regional Comparison - South America

12.6.1 Brazil - Market size and forecast 2025-2030

Chart on Brazil - Market size and forecast 2025-2030 ($ million)
Data Table on Brazil - Market size and forecast 2025-2030 ($ million)
Chart on Brazil - Year-over-year growth 2025-2030 (%)
Data Table on Brazil - Year-over-year growth 2025-2030 (%)

12.6.2 Argentina - Market size and forecast 2025-2030

Chart on Argentina - Market size and forecast 2025-2030 ($ million)
Data Table on Argentina - Market size and forecast 2025-2030 ($ million)
Chart on Argentina - Year-over-year growth 2025-2030 (%)
Data Table on Argentina - Year-over-year growth 2025-2030 (%)

12.6.3 Chile - Market size and forecast 2025-2030

Chart on Chile - Market size and forecast 2025-2030 ($ million)
Data Table on Chile - Market size and forecast 2025-2030 ($ million)
Chart on Chile - Year-over-year growth 2025-2030 (%)
Data Table on Chile - Year-over-year growth 2025-2030 (%)

12.7 Middle East and Africa - Market size and forecast 2025-2030

Chart on Middle East and Africa - Market size and forecast 2025-2030 ($ million)
Data Table on Middle East and Africa - Market size and forecast 2025-2030 ($ million)
Chart on Middle East and Africa - Year-over-year growth 2025-2030 (%)
Data Table on Middle East and Africa - Year-over-year growth 2025-2030 (%)
Chart on Regional Comparison - Middle East and Africa
Data Table on Regional Comparison - Middle East and Africa

12.7.1 Turkey - Market size and forecast 2025-2030

Chart on Turkey - Market size and forecast 2025-2030 ($ million)
Data Table on Turkey - Market size and forecast 2025-2030 ($ million)
Chart on Turkey - Year-over-year growth 2025-2030 (%)
Data Table on Turkey - Year-over-year growth 2025-2030 (%)

12.7.2 Saudi Arabia - Market size and forecast 2025-2030

Chart on Saudi Arabia - Market size and forecast 2025-2030 ($ million)
Data Table on Saudi Arabia - Market size and forecast 2025-2030 ($ million)
Chart on Saudi Arabia - Year-over-year growth 2025-2030 (%)
Data Table on Saudi Arabia - Year-over-year growth 2025-2030 (%)

12.7.3 Israel - Market size and forecast 2025-2030

Chart on Israel - Market size and forecast 2025-2030 ($ million)
Data Table on Israel - Market size and forecast 2025-2030 ($ million)
Chart on Israel - Year-over-year growth 2025-2030 (%)
Data Table on Israel - Year-over-year growth 2025-2030 (%)

12.7.4 South Africa - Market size and forecast 2025-2030

Chart on South Africa - Market size and forecast 2025-2030 ($ million)
Data Table on South Africa - Market size and forecast 2025-2030 ($ million)
Chart on South Africa - Year-over-year growth 2025-2030 (%)
Data Table on South Africa - Year-over-year growth 2025-2030 (%)

12.7.5 UAE - Market size and forecast 2025-2030

Chart on UAE - Market size and forecast 2025-2030 ($ million)
Data Table on UAE - Market size and forecast 2025-2030 ($ million)
Chart on UAE - Year-over-year growth 2025-2030 (%)
Data Table on UAE - Year-over-year growth 2025-2030 (%)

12.8 Market opportunity by geography

Market opportunity by geography ($ million)
Data Tables on Market opportunity by geography ($ million)

13. Drivers, Challenges, and Opportunity

13.1 Market drivers

Pervasive integration of generative AI in creative production
Meteoric rise of retail media networks and commerce media
Explosive expansion of connected TV and programmatic video

13.2 Market challenges

Deprecation of third-party cookies and privacy compliance strain
Proliferation of sophisticated digital ad fraud and invalid traffic
Heightened economic volatility and client campaign budget cuts

13.3 Impact of drivers and challenges

Impact of drivers and challenges in 2025 and 2030

13.4 Market opportunities

Commercial transition toward first-party clean rooms and unified IDs
Rapid shift toward attention metrics and quality media curation
Explosive growth of creator commerce and influencer agency services

14. Competitive Landscape

14.1 Overview

14.2

Overview on criticality of inputs and factors of differentiation

14.3 Landscape disruption

Overview on factors of disruption

14.4 Industry risks

Impact of key risks on business

15. Competitive Analysis

15.1 Companies profiled

Companies covered

15.2 Company ranking index

15.3 Market positioning of companies

Matrix on companies position and classification

15.4 Accenture Plc

Accenture Plc - Overview
Accenture Plc - Business segments
Accenture Plc - Key news
Accenture Plc - Key offerings
Accenture Plc - Segment focus
SWOT

15.5 BlueFocus Intelligent

BlueFocus Intelligent - Overview
BlueFocus Intelligent - Business segments
BlueFocus Intelligent - Key offerings
BlueFocus Intelligent - Segment focus
SWOT

15.6 Cheil Worldwide Inc.

Cheil Worldwide Inc. - Overview
Cheil Worldwide Inc. - Product / Service
Cheil Worldwide Inc. - Key offerings
SWOT

15.7 Dentsu Group Inc.

Dentsu Group Inc. - Overview
Dentsu Group Inc. - Business segments
Dentsu Group Inc. - Key offerings
Dentsu Group Inc. - Segment focus
SWOT

15.8 Hakuhodo DY Holdings Inc.

Hakuhodo DY Holdings Inc. - Overview
Hakuhodo DY Holdings Inc. - Product / Service
Hakuhodo DY Holdings Inc. - Key offerings
SWOT

15.9 Horizon Media LLC

Horizon Media LLC - Overview
Horizon Media LLC - Product / Service
Horizon Media LLC - Key offerings
SWOT

15.10 Omnicom Group Inc.

Omnicom Group Inc. - Overview
Omnicom Group Inc. - Business segments
Omnicom Group Inc. - Key offerings
Omnicom Group Inc. - Segment focus
SWOT

15.11 Plus Co Inc.

Plus Co Inc. - Overview
Plus Co Inc. - Product / Service
Plus Co Inc. - Key offerings
SWOT

15.12 Publicis Groupe SA

Publicis Groupe SA - Overview
Publicis Groupe SA - Product / Service
Publicis Groupe SA - Key offerings
SWOT

15.13 RGA Media Group Inc.

RGA Media Group Inc. - Overview
RGA Media Group Inc. - Product / Service
RGA Media Group Inc. - Key offerings
SWOT

15.14 S4Capital plc

S4Capital plc - Overview
S4Capital plc - Business segments
S4Capital plc - Key offerings
S4Capital plc - Segment focus
SWOT

15.15 Serviceplan Group SE and Co. KG

Serviceplan Group SE and Co. KG - Overview
Serviceplan Group SE and Co. KG - Product / Service
Serviceplan Group SE and Co. KG - Key offerings
SWOT

15.16 Stagwell Inc.

Stagwell Inc. - Overview
Stagwell Inc. - Business segments
Stagwell Inc. - Key offerings
Stagwell Inc. - Segment focus
SWOT

15.17 The Brandtech Group LLC

The Brandtech Group LLC - Overview
The Brandtech Group LLC - Product / Service
The Brandtech Group LLC - Key offerings
SWOT

15.18 WPP Plc

WPP Plc - Overview
WPP Plc - Business segments
WPP Plc - Key offerings
WPP Plc - Segment focus
SWOT

16. Appendix

16.1 Scope of the report

Market definition
Objectives
Notes and caveats

16.2 Inclusions and exclusions checklist

Inclusions checklist
Exclusions checklist

16.3 Currency conversion rates for US$

16.4 Research methodology

16.5 Data procurement

Information sources

16.6 Data validation

16.7 Validation techniques employed for market sizing

16.8 Data synthesis

16.9 360 degree market analysis

16.10 List of abbreviations

Research Methodology

Technavio presents a detailed picture of the market by way of study, synthesis, and summation of data from multiple sources. The analysts have presented the various facets of the market with a particular focus on identifying the key industry influencers. The data thus presented is comprehensive, reliable, and the result of extensive research, both primary and secondary.

INFORMATION SOURCES

Primary sources

  • Manufacturers and suppliers
  • Channel partners
  • Industry experts
  • Strategic decision makers

Secondary sources

  • Industry journals and periodicals
  • Government data
  • Financial reports of key industry players
  • Historical data
  • Press releases

DATA ANALYSIS

Data Synthesis

  • Collation of data
  • Estimation of key figures
  • Analysis of derived insights

Data Validation

  • Triangulation with data models
  • Reference against proprietary databases
  • Corroboration with industry experts

REPORT WRITING

Qualitative

  • Market drivers
  • Market challenges
  • Market trends
  • Five forces analysis

Quantitative

  • Market size and forecast
  • Market segmentation
  • Geographical insights
  • Competitive landscape

Interested in this report?

Get your sample now to see our research methodology and insights!

Download Now

Frequently Asked Questions

Advertising Services market growth will increase by USD 177920.5 million during 2026-2030.

The Advertising Services market is expected to grow at a CAGR of 4.5% during 2026-2030.

Advertising Services market is segmented by Type (Digital advertising, TV advertising, Print advertising, OOH advertising, Others) Platform (Online advertising, Offline advertising) End-user (Consumer goods and retail, IT and telecom, Government and public sector, BFSI, Others)

Accenture Plc, BlueFocus Intelligent, Cheil Worldwide Inc., Dentsu Group Inc., Dept Holding B.V., Enero Group Ltd, Hakuhodo DY Holdings Inc., Horizon Media LLC, Jellyfish Group Ltd, Omnicom Group Inc., Plus Co Inc., Publicis Groupe SA, RGA Media Group Inc., S4Capital plc, Serviceplan Group SE and Co. KG, Stagwell Inc., The Brandtech Group LLC, VaynerMedia LLC, Wieden Kennedy, WPP Plc are a few of the key vendors in the Advertising Services market.

North America will register the highest growth rate of 38.9% among the other regions. Therefore, the Advertising Services market in North America is expected to garner significant business opportunities for the vendors during the forecast period.

US, Canada, Mexico, China, Japan, India, Australia, South Korea, Indonesia, UK, Germany, France, Italy, Spain, The Netherlands, Brazil, Argentina, Chile, Turkey, Saudi Arabia, Israel, South Africa, UAE

  • Pervasive integration of generative AI in creative production is the driving factor this market.

The Advertising Services market vendors should focus on grabbing business opportunities from the Type segment as it accounted for the largest market share in the base year.
RIA - Research AI Assistant
Ask RIA