4K2K TV Market Analysis, Size, and Forecast 2026-2030: APAC (China, India, and Japan), North America (US, Canada, and Mexico), Europe (Germany, UK, and France), South America (Brazil, Argentina, and Chile), Middle East and Africa (Saudi Arabia, UAE, and South Africa), and Rest of World (ROW)

4K2K TV Market Analysis, Size, and Forecast 2026-2030:
APAC (China, India, and Japan), North America (US, Canada, and Mexico), Europe (Germany, UK, and France), South America (Brazil, Argentina, and Chile), Middle East and Africa (Saudi Arabia, UAE, and South Africa), and Rest of World (ROW)

Published: May 2026 300 Pages SKU: IRTNTR70652

Market Overview at a Glance

$19.23 B
Market Opportunity
6%
CAGR 2025 - 2030
49.8%
APAC Growth
$21.85 B
60 to 69 inches segment 2024

4K2K Tv Market Size and Growth Forecast 2026-2030

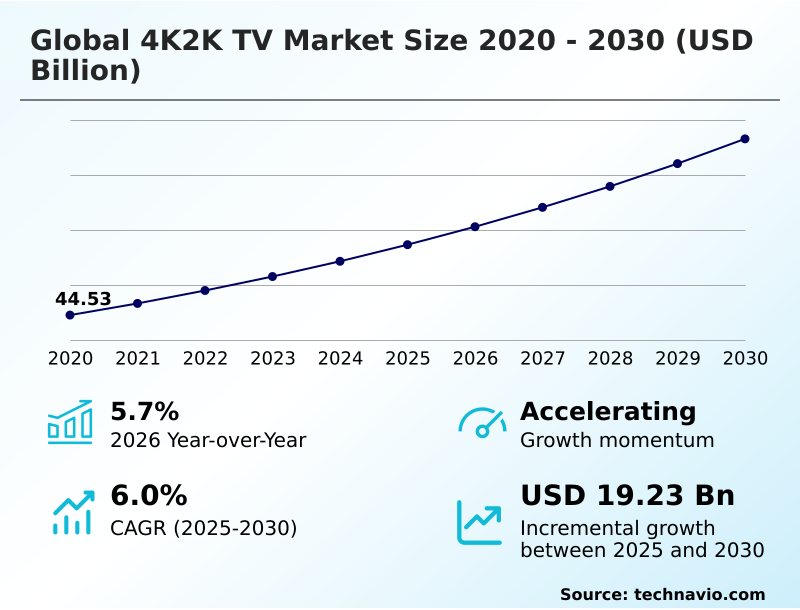
The 4K2K Tv Market size was valued at USD 57.33 billion in 2025 growing at a CAGR of 6% during the forecast period 2026-2030.

APAC accounts for 49.8% of incremental growth during the forecast period. The 60 to 69 inches segment by Display Size was valued at USD 21.85 billion in 2024, while the Offline segment holds the largest revenue share by Distribution Channel.

The market is projected to grow by USD 32.04 billion from 2020 to 2030, with USD 19.23 billion of the growth expected during the forecast period of 2025 to 2030.

Get Key Insights on Market Forecast (PDF) Request Free Sample

4K2K Tv Market Overview

The 4k2k tv market is undergoing a significant transformation, driven by the standardization of ultra-high-definition as the baseline for modern home entertainment. This evolution is defined by the convergence of advanced panel architectures like mini-led backlighting and organic light-emitting diode technology, which deliver superior color and contrast. Growth is further propelled by a robust content ecosystem, where high-bandwidth streaming and next-generation gaming consoles make 4k resolution an essential requirement. In the commercial sector, a premium hotel chain might deploy a network of 4k2k tv displays for digital signage solutions and in-room entertainment, leveraging a unified smart tv operating system for content management and guest services, resulting in a consistent brand experience and new ancillary revenue streams. North America is a key region, contributing over 22% of the market's incremental growth, fueled by a premium consumer demographic demanding larger screens and integrated home entertainment hubs. The focus on eco-design requirements, compliant with standards like RoHS, is also shaping manufacturing processes and vendor qualification criteria. This dynamic environment necessitates continuous innovation in both hardware, with features like hdmi 2.1 connectivity, and software, including sophisticated image enhancement algorithms.

Drivers, Trends, and Challenges in the 4K2K Tv Market

The global 4k2k tv market 2026-2030 is advancing on multiple fronts, with procurement decisions heavily influenced by specific use cases. The demand for 4k2k tv for competitive esports and high-refresh-rate displays for console gaming is driving the adoption of panels with a 4k tv with 120hz native refresh rate and features ensuring low input lag for responsive gaming.

Concurrently, manufacturers are addressing the content gap with sophisticated ai-enhanced upscaling for legacy content and ai-powered image processing for sports, powered by vision ai for conversational interaction that personalizes the viewing experience.

Aesthetically, bezel-less designs for seamless integration and art mode features in premium televisions cater to design-conscious buyers, while the wireless zero connect box for minimalist installation declutters living spaces. In terms of display technology, tandem oled for increased panel lifespan and mini-led with high local dimming zones are key differentiators.

For streaming, hdr format support for streaming services is a baseline expectation, supported by av1 and vvc video codec implementation and integrated wi-fi 7 modules for buffer-free streaming. Beyond entertainment, the use of 4k display for medical imaging diagnostics and 4k resolution for large-format digital signage highlights growing commercial applications.

These innovations are developed within strict regulatory frameworks, such as the EU's RoHS directive, compelling investment in energy-efficient oled panel manufacturing. This contrasts with the growing popularity of ultra-short-throw laser projectors vs 4k tv, a substitute that offers scale but often trades off brightness and smart features.

The integration of a smart tv with integrated voice control solidifies the television's role as a central smart home hub.

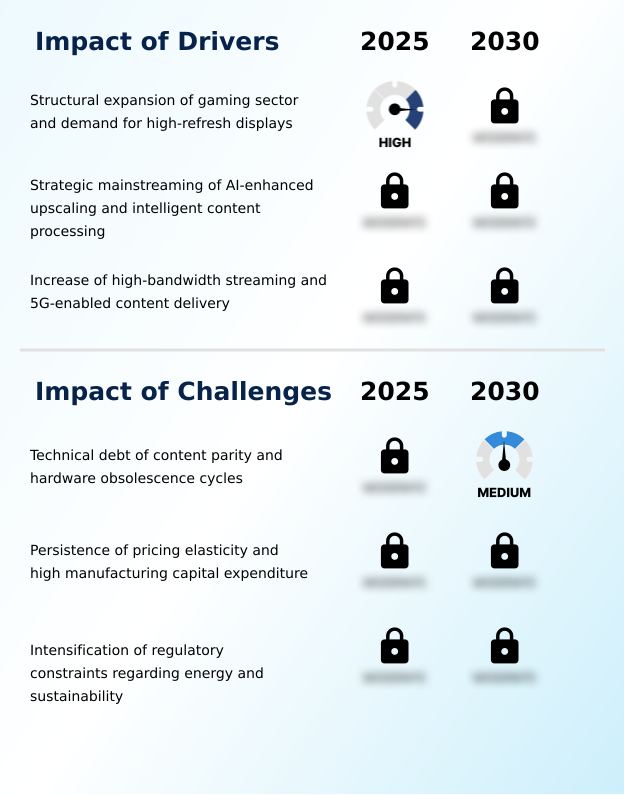
Primary Growth Driver: The structural expansion of the global gaming sector, coupled with persistent demand for high-refresh-rate displays, serves as a key driver for market adoption.

Demand from the console gaming and competitive esports sectors for gaming-optimized displays is a powerful driver, pushing for features like variable refresh rate and auto low latency mode as standard.

This is compelling manufacturers to deliver panels with high refresh rates and minimal input lag.

A second major driver is the strategic mainstreaming of ai-enhanced upscaling for legacy content, where advanced neural processing units use on-device machine learning to improve lower-resolution source material for a consistent UHD experience.

This software-led enhancement is critical for user satisfaction. Finally, the proliferation of high-bandwidth streaming, enabled by fiber and 5G infrastructure, is a fundamental catalyst.

With over two-thirds of streaming revenue coming from 4K services, the demand for hardware capable of seamless, high-fidelity playback is assured.

Emerging Market Trend: The inclusion of generative artificial intelligence and cognitive vision processing represents a significant upcoming trend, shifting televisions from passive displays toward active, intelligent content enhancement platforms.

A primary trend is the institutionalization of generative AI and cognitive vision processing, shifting image enhancement from static algorithms to dynamic, vision ai platforms. These systems analyze content frame-by-frame, a crucial feature for ultra-large displays.

Another significant shift is toward advanced panel architectures like rgb tandem oled and high-density mini-led backlighting, which are engineered to achieve unprecedented peak luminance and color volume for vibrant HDR performance. This technology, once reserved for flagship models, is now being integrated into more accessible product tiers, representing a democratization of premium features.

Furthermore, the market is expanding toward ultra-thin aesthetics, with wallpaper form factors and wireless connectivity ecosystems eliminating visible cabling to create a minimalist, integrated look that aligns with modern interior design priorities.

Key Industry Challenge: A key challenge affecting industry growth is the technical debt created by the disparity between hardware capabilities and native content availability, compounded by rapid hardware obsolescence cycles.

A significant challenge is the technical debt arising from the gap between advanced hardware capabilities and the limited availability of native 4K content, which creates issues of hardware obsolescence. While ai-driven upscaling helps, it adds cost and complexity to the smart tv operating system. Secondly, the market grapples with intense price elasticity and high manufacturing capital expenditure.

Investing in next-generation fabs for organic light-emitting diode or mini-led backlighting is costly, yet commoditization compresses margins, especially in emerging economies. Finally, intensifying regulatory constraints, particularly the EU's eco-design requirements under Regulation (EU) 2023/826, pose a technical threat.

These stringent power consumption mandates require heavy R&D investment in energy-efficient components like blue phosphorescent oled panels, creating significant compliance burdens and risking market exclusion for non-compliant high-performance models.

Explore Full Market Dynamics Analysis Request Free Sample

4K2K Tv Market Segmentation

The 4k2k tv industry research report provides comprehensive data including region-wise segment analysis, with forecasts and analysis for the period 2026-2030, as well as historical data from 2020-2024 for the following segments.

Market Segment by Display size
  • 60 to 69 inches
  • 50 to 59 inches
  • Less than 49 inches
  • 70 to 79 inches
  • 80 and above
Market Segment by Distribution channel
  • Offline
  • Online
Market Segment by Application
  • Household
  • Commercial
Market Segment by Geography
APAC
China, India, Japan, South Korea, Indonesia, Australia
North America
US, Canada, Mexico
Europe
Germany, UK, France, Italy, Spain, The Netherlands
South America
Brazil, Argentina, Chile
Middle East and Africa
Saudi Arabia, UAE, South Africa, Turkey, Israel

Display Size Segment Analysis

The 60 to 69 inches segment is estimated to witness significant growth during the forecast period.

The 60 to 69 inches segment is a high-growth tier, increasingly becoming the default choice for consumers seeking a balance between immersive scale and practical fit for residential spaces.

This category, particularly 65-inch models, benefits from manufacturing efficiencies that make premium technologies more accessible. The integration of advanced neural processing units facilitates superior ai-driven upscaling and real-time picture optimization, delivering cinematic picture quality from varied sources.

Technologies like organic light-emitting diode (OLED) and backlights with dense local dimming zones are pivotal, offering the contrast and peak luminance necessary for a compelling home cinema experience.

As fabrication costs for large panels decline, this segment is capturing a substantial share of the upgrade market, especially within the premium consumer demographic.

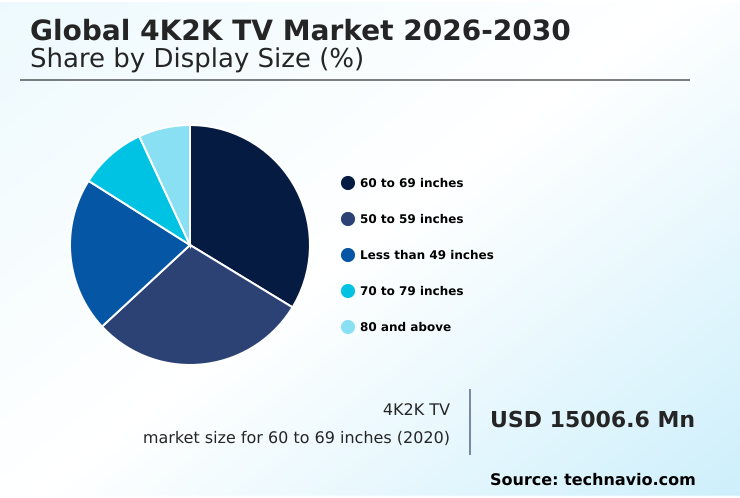
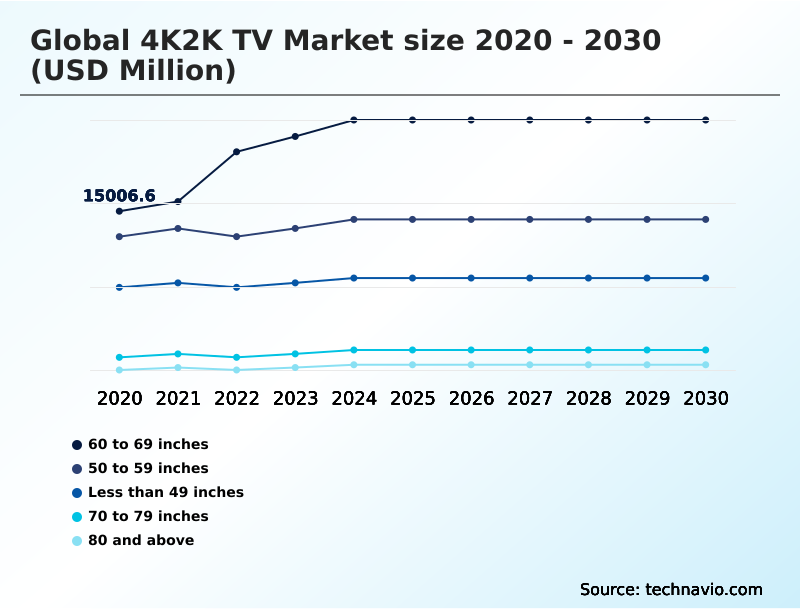
The 60 to 69 inches segment was valued at USD 21.85 billion in 2024 and showed a gradual increase during the forecast period.

4K2K Tv Market by Region: APAC Leads with 49.8% Growth Share

APAC is estimated to contribute 49.8% to the growth of the global market during the forecast period.

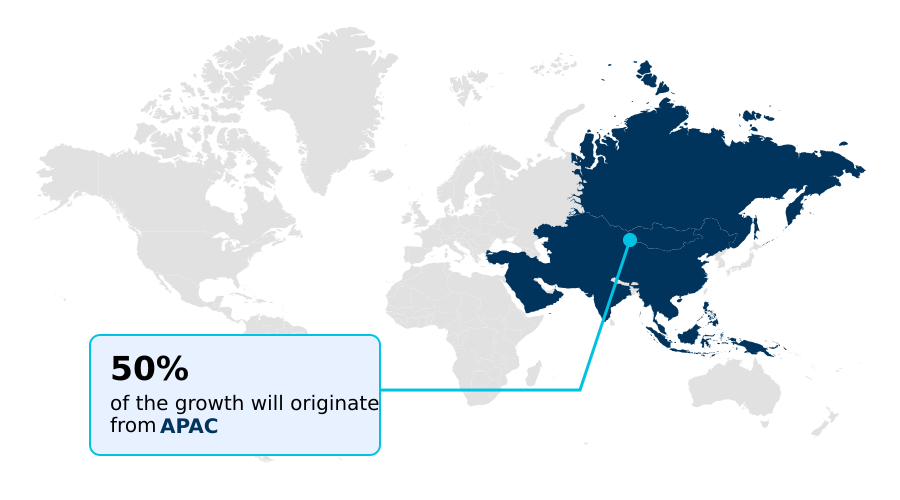
The APAC region is the largest and most dynamic geography, serving as the market's primary growth engine and contributing nearly 50% of the global incremental growth.

This dominance is fueled by a massive manufacturing base, rapid urbanization, and aggressive government initiatives promoting domestic production of display components. In countries like China and India, the convergence of affordable hardware and localized digital content has democratized high-definition viewing.

The regional market is defined by a rapid adoption of smart features, including ai-driven upscaling and integration with cloud gaming platforms.

This focus on connectivity, supported by widespread 5G deployment, provides the necessary infrastructure for seamless 4K streaming and interactive immersion, positioning the region as the epicenter for both production and consumption of advanced digital signage solutions and professional monitoring displays.

Customer Landscape Analysis for the 4K2K Tv Market

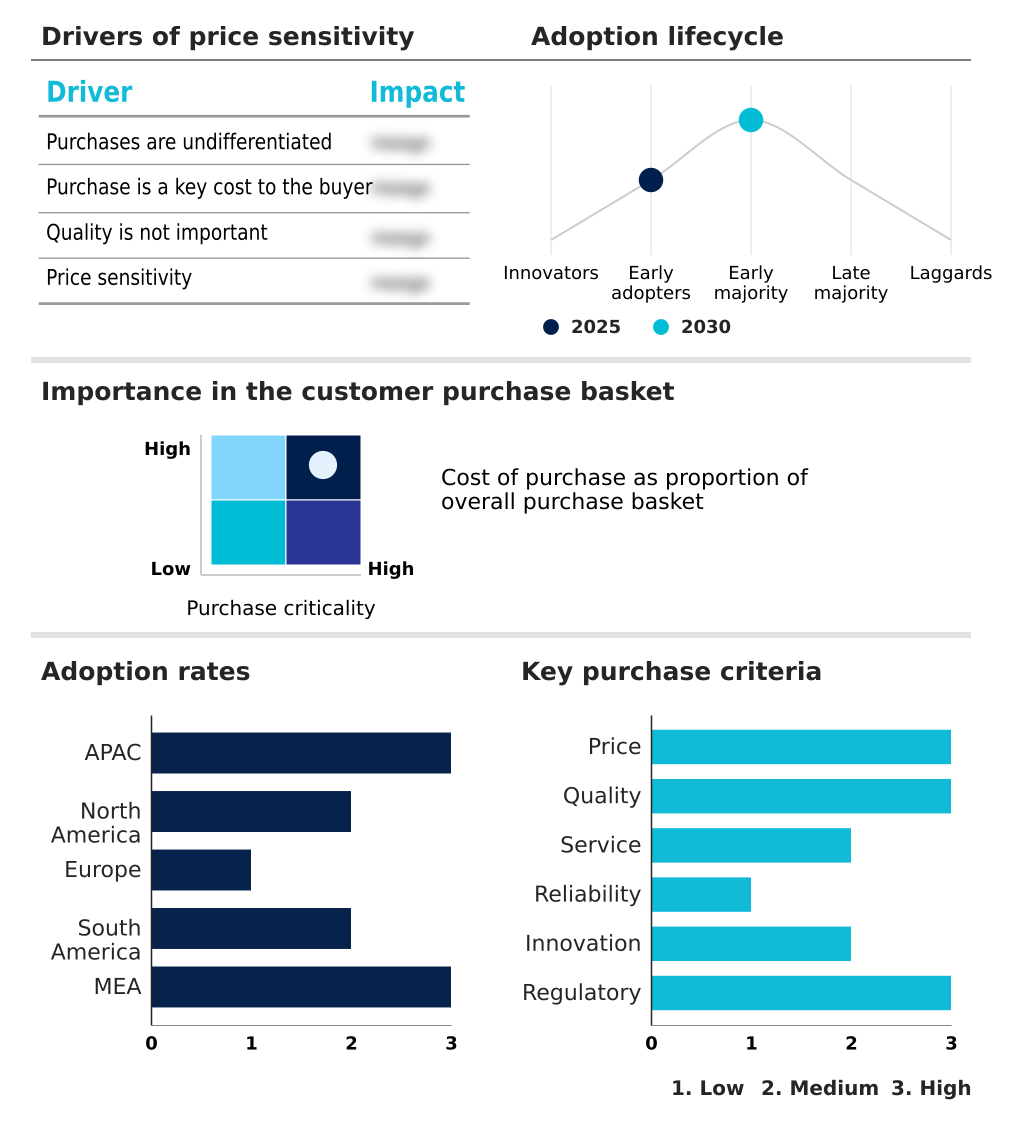
The 4k2k tv market forecasting report includes the adoption lifecycle of the market, covering from the innovator’s stage to the laggard’s stage. It focuses on adoption rates in different regions based on penetration. Furthermore, the 4k2k tv market report also includes key purchase criteria and drivers of price sensitivity to help companies evaluate and develop their market growth analysis strategies.

Competitive Landscape of the 4K2K Tv Market

Companies are implementing various strategies, such as strategic alliances, partnerships, mergers and acquisitions, geographical expansion, and product/service launches, to enhance their presence in the 4k2k tv market industry.

Element Electronics Holdings LLC - A key portfolio integrates advanced QLED and OLED displays with high-resolution smart entertainment platforms, focusing on premium visual performance and robust connectivity.

The industry research and growth report includes detailed analyses of the competitive landscape of the market and information about key companies, including:

  • Element Electronics Holdings LLC
  • Funai Electric Co. Ltd.
  • Grundig Intermedia GmbH
  • Haier Smart Home Co. Ltd.
  • Hisense International Co. Ltd.
  • Koninklijke Philips NV
  • LG Electronics Inc.
  • OnePlus Technology Co. Ltd.
  • Panasonic Holdings Corp.
  • Realme Chongqing Mobile Corp.
  • Samsung Electronics Co. Ltd.
  • Sharp Corp.
  • Skyworth Group Ltd.
  • Sony Group Corp.
  • TCL Industries Holdings Ltd.
  • Toshiba Corp.
  • TPV Technology Co. Ltd.
  • VIZIO Holding Corp.
  • Vu Technologies Pvt. Ltd.
  • Xiaomi Corp.

Qualitative and quantitative analysis of companies has been conducted to help clients understand the wider business environment as well as the strengths and weaknesses of key industry players. Data is qualitatively analyzed to categorize companies as pure play, category-focused, industry-focused, and diversified; it is quantitatively analyzed to categorize companies as dominant, leading, strong, tentative, and weak.

Recent Developments in the 4K2K Tv Market

  • In January 2025, Samsung Electronics Co. Ltd. unveiled its 130-inch Micro RGB television at CES, equipped with the AI-driven NQ4 Gen3 processor and the Vision AI Companion platform.
  • In March 2025, LG Electronics Inc. introduced its OLED evo series featuring the Alpha 11 AI Processor Gen3 and Hyper Radiant Color technology, designed to deliver significantly enhanced brightness levels.
  • In February 2025, Skyworth Group Ltd. completed the acquisition of Panasonic's television business operations in Europe and the United States, a move that reshapes regional market influence and distribution networks.
  • In April 2025, TCL Industries Holdings Ltd. showcased its next-generation SQD-Mini LED technology, demonstrating panels capable of achieving peak brightness levels of 10,000 nits for high-impact HDR performance.

Research Analyst Overview: 4K2K Tv Market

The market's competitive intensity is forcing a strategic pivot from resolution commoditization to value creation through integrated intelligence and specialized hardware. While the 50-59 inch segment continues to drive volume, boardroom focus is shifting to the high capital expenditure required for next-generation fabrication lines producing micro-led displays and rgb tandem oled panels.

This investment is critical for achieving the performance metrics demanded by both consumers and stringent regulations like the EU's energy-efficiency standards, which favor innovations such as blue phosphorescent oled technology. Adherence to technical standards like hdmi 2.1 connectivity is now table stakes, with differentiation coming from proprietary neural processing units that enable superior cognitive vision processing and ai-driven upscaling.

For procurement decision-makers, this means evaluating not just the panel but the entire smart tv operating system and its vision ai platforms, as these software layers increasingly define the product's long-term value and capability for on-device machine learning and real-time picture optimization.

Vendor qualification now extends to assessing a supplier's roadmap for 8k upscaling and support for advanced codecs like the av1 video codec.

Dive into Technavio’s robust research methodology, blending expert interviews, extensive data synthesis, and validated models for unparalleled 4K2K Tv Market insights. See full methodology.

Request Free Sample

Market Scope
Page number 300
Base year 2025
Historic period 2020-2024
Forecast period 2026-2030
Growth momentum & CAGR Accelerate at a CAGR of 6%
Market growth 2026-2030 USD 19234.6 million
Market structure Fragmented
YoY growth 2025-2026(%) 5.7%
Key countries China, India, Japan, South Korea, Indonesia, Australia, US, Canada, Mexico, Germany, UK, France, Italy, Spain, The Netherlands, Brazil, Argentina, Chile, Saudi Arabia, UAE, South Africa, Turkey and Israel
Competitive landscape Leading Companies, Market Positioning of Companies, Competitive Strategies, and Industry Risks

4K2K Tv Market: Key Questions Answered in This Report

  • What is the expected growth of the 4K2K Tv Market between 2026 and 2030?

    • The 4K2K Tv Market is expected to grow by USD 19.23 billion during 2026-2030, registering a CAGR of 6%. Year-over-year growth in 2026 is estimated at 5.7%%. This acceleration is shaped by structural expansion of gaming sector and demand for high-refresh displays, which is intensifying demand across multiple end-use verticals covered in the report.

  • What segmentation does the market report cover?

    • The report is segmented by Display Size (60 to 69 inches, 50 to 59 inches, Less than 49 inches, 70 to 79 inches, and 80 and above), Distribution Channel (Offline, and Online), Application (Household, and Commercial) and Geography (APAC, North America, Europe, South America, Middle East and Africa). Among these, the 60 to 69 inches segment is estimated to witness significant growth during the forecast period, driven by rising adoption across key application areas. Each segment includes detailed qualitative and quantitative analysis, along with historical data from 2020-2024 and forecasts through 2030 with year-over-year growth rates.

  • Which regions are analyzed in the report?

    • The report covers APAC, North America, Europe, South America and Middle East and Africa. APAC is estimated to contribute 49.8% to market growth during the forecast period. Country-level analysis includes China, India, Japan, South Korea, Indonesia, Australia, US, Canada, Mexico, Germany, UK, France, Italy, Spain, The Netherlands, Brazil, Argentina, Chile, Saudi Arabia, UAE, South Africa, Turkey and Israel, with dedicated market size tables and year-over-year growth for each.

  • What are the key growth drivers and market challenges?

    • The primary driver is structural expansion of gaming sector and demand for high-refresh displays, which is accelerating investment and industry demand. The main challenge is technical debt of content parity and hardware obsolescence cycles, creating operational barriers for key market participants. The report quantifies the impact of each driver and challenge across 2026 and 2030 with comparative analysis.

  • Who are the major players in the 4K2K Tv Market?

    • Key vendors include Element Electronics Holdings LLC, Funai Electric Co. Ltd., Grundig Intermedia GmbH, Haier Smart Home Co. Ltd., Hisense International Co. Ltd., Koninklijke Philips NV, LG Electronics Inc., OnePlus Technology Co. Ltd., Panasonic Holdings Corp., Realme Chongqing Mobile Corp., Samsung Electronics Co. Ltd., Sharp Corp., Skyworth Group Ltd., Sony Group Corp., TCL Industries Holdings Ltd., Toshiba Corp., TPV Technology Co. Ltd., VIZIO Holding Corp., Vu Technologies Pvt. Ltd. and Xiaomi Corp.. The report provides qualitative and quantitative analysis categorizing companies as dominant, leading, strong, tentative, and weak based on their market positioning. Company profiles include business segment analysis, SWOT assessment, key offerings, and recent strategic developments.

4K2K Tv Market Research Insights

Market dynamics are increasingly shaped by the push for interactive immersion and the need to manage hardware obsolescence. As display technologies mature, differentiation is shifting toward software-driven features like intelligent content recommendation engines and seamless integration into wireless connectivity ecosystems. This pivot addresses consumer demand for a cohesive home cinema experience without the clutter of traditional setups.

However, manufacturers must navigate strict eco-design requirements, such as the European Union's Regulation (EU) 2023/826, which imposes rigorous power consumption limits. This regulatory pressure influences capital expenditure decisions, steering investment toward more efficient panel technologies.

Geographically, APAC's growth, driven by markets like China, outpaces Europe, reflecting different consumer priorities and regulatory landscapes influencing the adoption of gaming-optimized displays and other premium features.

We can help! Our analysts can customize this 4k2k tv market research report to meet your requirements.

Get in touch

1. Executive Summary

1.1 Market overview

Executive Summary - Chart on Market Overview
Executive Summary - Data Table on Market Overview
Executive Summary - Chart on Global Market Characteristics
Executive Summary - Chart on Market by Geography
Executive Summary - Chart on Market Segmentation by Display Size
Executive Summary - Chart on Market Segmentation by Distribution Channel
Executive Summary - Chart on Market Segmentation by Application
Executive Summary - Chart on Incremental Growth
Executive Summary - Data Table on Incremental Growth
Executive Summary - Chart on Company Market Positioning

2. Technavio Analysis

2.1 Analysis of price sensitivity, lifecycle, customer purchase basket, adoption rates, and purchase criteria

2.2 Criticality of inputs and Factors of differentiation

Chart on Overview on criticality of inputs and factors of differentiation

2.3 Factors of disruption

Chart on Overview on factors of disruption

2.4 Impact of drivers and challenges

Chart on Impact of drivers and challenges in 2025 and 2030

3. Market Landscape

3.1 Market ecosystem

Chart on Parent Market
Data Table on - Parent Market

3.2 Market characteristics

Chart on Market characteristics analysis

3.3 Value chain analysis

Chart on Value chain analysis

4. Market Sizing

4.1 Market definition

Data Table on Offerings of companies included in the market definition

4.2 Market segment analysis

Market segments

4.3 Market size 2025

4.4 Market outlook: Forecast for 2025-2030

Chart on Global - Market size and forecast 2025-2030 ($ million)
Data Table on Global - Market size and forecast 2025-2030 ($ million)
Chart on Global Market: Year-over-year growth 2025-2030 (%)
Data Table on Global Market: Year-over-year growth 2025-2030 (%)

5. Historic Market Size

5.1 Global 4K2K TV Market 2020 - 2024

Historic Market Size - Data Table on Global 4K2K TV Market 2020 - 2024 ($ million)

5.2 Display Size segment analysis 2020 - 2024

Historic Market Size - Display Size Segment 2020 - 2024 ($ million)

5.3 Distribution Channel segment analysis 2020 - 2024

Historic Market Size - Distribution Channel Segment 2020 - 2024 ($ million)

5.4 Application segment analysis 2020 - 2024

Historic Market Size - Application Segment 2020 - 2024 ($ million)

5.5 Geography segment analysis 2020 - 2024

Historic Market Size - Geography Segment 2020 - 2024 ($ million)

5.6 Country segment analysis 2020 - 2024

Historic Market Size - Country Segment 2020 - 2024 ($ million)

6. Qualitative Analysis

6.1 Impact of AI in global 4K2K TV market

6.2 Impact of geopolitical conflict for global 4K2K TV market

7. Five Forces Analysis

7.1 Five forces summary

Five forces analysis - Comparison between 2025 and 2030

7.2 Bargaining power of buyers

Bargaining power of buyers - Impact of key factors 2025 and 2030

7.3 Bargaining power of suppliers

Bargaining power of suppliers - Impact of key factors in 2025 and 2030

7.4 Threat of new entrants

Threat of new entrants - Impact of key factors in 2025 and 2030

7.5 Threat of substitutes

Threat of substitutes - Impact of key factors in 2025 and 2030

7.6 Threat of rivalry

Threat of rivalry - Impact of key factors in 2025 and 2030

7.7 Market condition

Chart on Market condition - Five forces 2025 and 2030

8. Market Segmentation by Display Size

8.1 Market segments

Chart on Display Size - Market share 2025-2030 (%)
Data Table on Display Size - Market share 2025-2030 (%)

8.2 Comparison by Display Size

Chart on Comparison by Display Size
Data Table on Comparison by Display Size

8.3 60 to 69 inches - Market size and forecast 2025-2030

Chart on 60 to 69 inches - Market size and forecast 2025-2030 ($ million)
Data Table on 60 to 69 inches - Market size and forecast 2025-2030 ($ million)
Chart on 60 to 69 inches - Year-over-year growth 2025-2030 (%)
Data Table on 60 to 69 inches - Year-over-year growth 2025-2030 (%)

8.4 50 to 59 inches - Market size and forecast 2025-2030

Chart on 50 to 59 inches - Market size and forecast 2025-2030 ($ million)
Data Table on 50 to 59 inches - Market size and forecast 2025-2030 ($ million)
Chart on 50 to 59 inches - Year-over-year growth 2025-2030 (%)
Data Table on 50 to 59 inches - Year-over-year growth 2025-2030 (%)

8.5 Less than 49 inches - Market size and forecast 2025-2030

Chart on Less than 49 inches - Market size and forecast 2025-2030 ($ million)
Data Table on Less than 49 inches - Market size and forecast 2025-2030 ($ million)
Chart on Less than 49 inches - Year-over-year growth 2025-2030 (%)
Data Table on Less than 49 inches - Year-over-year growth 2025-2030 (%)

8.6 70 to 79 inches - Market size and forecast 2025-2030

Chart on 70 to 79 inches - Market size and forecast 2025-2030 ($ million)
Data Table on 70 to 79 inches - Market size and forecast 2025-2030 ($ million)
Chart on 70 to 79 inches - Year-over-year growth 2025-2030 (%)
Data Table on 70 to 79 inches - Year-over-year growth 2025-2030 (%)

8.7 80 and above - Market size and forecast 2025-2030

Chart on 80 and above - Market size and forecast 2025-2030 ($ million)
Data Table on 80 and above - Market size and forecast 2025-2030 ($ million)
Chart on 80 and above - Year-over-year growth 2025-2030 (%)
Data Table on 80 and above - Year-over-year growth 2025-2030 (%)

8.8 Market opportunity by Display Size

Market opportunity by Display Size ($ million)
Data Table on Market opportunity by Display Size ($ million)

9. Market Segmentation by Distribution Channel

9.1 Market segments

Chart on Distribution Channel - Market share 2025-2030 (%)
Data Table on Distribution Channel - Market share 2025-2030 (%)

9.2 Comparison by Distribution Channel

Chart on Comparison by Distribution Channel
Data Table on Comparison by Distribution Channel

9.3 Offline - Market size and forecast 2025-2030

Chart on Offline - Market size and forecast 2025-2030 ($ million)
Data Table on Offline - Market size and forecast 2025-2030 ($ million)
Chart on Offline - Year-over-year growth 2025-2030 (%)
Data Table on Offline - Year-over-year growth 2025-2030 (%)

9.4 Online - Market size and forecast 2025-2030

Chart on Online - Market size and forecast 2025-2030 ($ million)
Data Table on Online - Market size and forecast 2025-2030 ($ million)
Chart on Online - Year-over-year growth 2025-2030 (%)
Data Table on Online - Year-over-year growth 2025-2030 (%)

9.5 Market opportunity by Distribution Channel

Market opportunity by Distribution Channel ($ million)
Data Table on Market opportunity by Distribution Channel ($ million)

10. Market Segmentation by Application

10.1 Market segments

Chart on Application - Market share 2025-2030 (%)
Data Table on Application - Market share 2025-2030 (%)

10.2 Comparison by Application

Chart on Comparison by Application
Data Table on Comparison by Application

10.3 Household - Market size and forecast 2025-2030

Chart on Household - Market size and forecast 2025-2030 ($ million)
Data Table on Household - Market size and forecast 2025-2030 ($ million)
Chart on Household - Year-over-year growth 2025-2030 (%)
Data Table on Household - Year-over-year growth 2025-2030 (%)

10.4 Commercial - Market size and forecast 2025-2030

Chart on Commercial - Market size and forecast 2025-2030 ($ million)
Data Table on Commercial - Market size and forecast 2025-2030 ($ million)
Chart on Commercial - Year-over-year growth 2025-2030 (%)
Data Table on Commercial - Year-over-year growth 2025-2030 (%)

10.5 Market opportunity by Application

Market opportunity by Application ($ million)
Data Table on Market opportunity by Application ($ million)

11. Customer Landscape

11.1 Customer landscape overview

Analysis of price sensitivity, lifecycle, customer purchase basket, adoption rates, and purchase criteria

12. Geographic Landscape

12.1 Geographic segmentation

Chart on Market share by geography 2025-2030 (%)
Data Table on Market share by geography 2025-2030 (%)

12.2 Geographic comparison

Chart on Geographic comparison
Data Table on Geographic comparison

12.3 APAC - Market size and forecast 2025-2030

Chart on APAC - Market size and forecast 2025-2030 ($ million)
Data Table on APAC - Market size and forecast 2025-2030 ($ million)
Chart on APAC - Year-over-year growth 2025-2030 (%)
Data Table on APAC - Year-over-year growth 2025-2030 (%)
Chart on Regional Comparison - APAC
Data Table on Regional Comparison - APAC

12.3.1 China - Market size and forecast 2025-2030

Chart on China - Market size and forecast 2025-2030 ($ million)
Data Table on China - Market size and forecast 2025-2030 ($ million)
Chart on China - Year-over-year growth 2025-2030 (%)
Data Table on China - Year-over-year growth 2025-2030 (%)

12.3.2 India - Market size and forecast 2025-2030

Chart on India - Market size and forecast 2025-2030 ($ million)
Data Table on India - Market size and forecast 2025-2030 ($ million)
Chart on India - Year-over-year growth 2025-2030 (%)
Data Table on India - Year-over-year growth 2025-2030 (%)

12.3.3 Japan - Market size and forecast 2025-2030

Chart on Japan - Market size and forecast 2025-2030 ($ million)
Data Table on Japan - Market size and forecast 2025-2030 ($ million)
Chart on Japan - Year-over-year growth 2025-2030 (%)
Data Table on Japan - Year-over-year growth 2025-2030 (%)

12.3.4 South Korea - Market size and forecast 2025-2030

Chart on South Korea - Market size and forecast 2025-2030 ($ million)
Data Table on South Korea - Market size and forecast 2025-2030 ($ million)
Chart on South Korea - Year-over-year growth 2025-2030 (%)
Data Table on South Korea - Year-over-year growth 2025-2030 (%)

12.3.5 Indonesia - Market size and forecast 2025-2030

Chart on Indonesia - Market size and forecast 2025-2030 ($ million)
Data Table on Indonesia - Market size and forecast 2025-2030 ($ million)
Chart on Indonesia - Year-over-year growth 2025-2030 (%)
Data Table on Indonesia - Year-over-year growth 2025-2030 (%)

12.3.6 Australia - Market size and forecast 2025-2030

Chart on Australia - Market size and forecast 2025-2030 ($ million)
Data Table on Australia - Market size and forecast 2025-2030 ($ million)
Chart on Australia - Year-over-year growth 2025-2030 (%)
Data Table on Australia - Year-over-year growth 2025-2030 (%)

12.4 North America - Market size and forecast 2025-2030

Chart on North America - Market size and forecast 2025-2030 ($ million)
Data Table on North America - Market size and forecast 2025-2030 ($ million)
Chart on North America - Year-over-year growth 2025-2030 (%)
Data Table on North America - Year-over-year growth 2025-2030 (%)
Chart on Regional Comparison - North America
Data Table on Regional Comparison - North America

12.4.1 US - Market size and forecast 2025-2030

Chart on US - Market size and forecast 2025-2030 ($ million)
Data Table on US - Market size and forecast 2025-2030 ($ million)
Chart on US - Year-over-year growth 2025-2030 (%)
Data Table on US - Year-over-year growth 2025-2030 (%)

12.4.2 Canada - Market size and forecast 2025-2030

Chart on Canada - Market size and forecast 2025-2030 ($ million)
Data Table on Canada - Market size and forecast 2025-2030 ($ million)
Chart on Canada - Year-over-year growth 2025-2030 (%)
Data Table on Canada - Year-over-year growth 2025-2030 (%)

12.4.3 Mexico - Market size and forecast 2025-2030

Chart on Mexico - Market size and forecast 2025-2030 ($ million)
Data Table on Mexico - Market size and forecast 2025-2030 ($ million)
Chart on Mexico - Year-over-year growth 2025-2030 (%)
Data Table on Mexico - Year-over-year growth 2025-2030 (%)

12.5 Europe - Market size and forecast 2025-2030

Chart on Europe - Market size and forecast 2025-2030 ($ million)
Data Table on Europe - Market size and forecast 2025-2030 ($ million)
Chart on Europe - Year-over-year growth 2025-2030 (%)
Data Table on Europe - Year-over-year growth 2025-2030 (%)
Chart on Regional Comparison - Europe
Data Table on Regional Comparison - Europe

12.5.1 Germany - Market size and forecast 2025-2030

Chart on Germany - Market size and forecast 2025-2030 ($ million)
Data Table on Germany - Market size and forecast 2025-2030 ($ million)
Chart on Germany - Year-over-year growth 2025-2030 (%)
Data Table on Germany - Year-over-year growth 2025-2030 (%)

12.5.2 UK - Market size and forecast 2025-2030

Chart on UK - Market size and forecast 2025-2030 ($ million)
Data Table on UK - Market size and forecast 2025-2030 ($ million)
Chart on UK - Year-over-year growth 2025-2030 (%)
Data Table on UK - Year-over-year growth 2025-2030 (%)

12.5.3 France - Market size and forecast 2025-2030

Chart on France - Market size and forecast 2025-2030 ($ million)
Data Table on France - Market size and forecast 2025-2030 ($ million)
Chart on France - Year-over-year growth 2025-2030 (%)
Data Table on France - Year-over-year growth 2025-2030 (%)

12.5.4 Italy - Market size and forecast 2025-2030

Chart on Italy - Market size and forecast 2025-2030 ($ million)
Data Table on Italy - Market size and forecast 2025-2030 ($ million)
Chart on Italy - Year-over-year growth 2025-2030 (%)
Data Table on Italy - Year-over-year growth 2025-2030 (%)

12.5.5 Spain - Market size and forecast 2025-2030

Chart on Spain - Market size and forecast 2025-2030 ($ million)
Data Table on Spain - Market size and forecast 2025-2030 ($ million)
Chart on Spain - Year-over-year growth 2025-2030 (%)
Data Table on Spain - Year-over-year growth 2025-2030 (%)

12.5.6 The Netherlands - Market size and forecast 2025-2030

Chart on The Netherlands - Market size and forecast 2025-2030 ($ million)
Data Table on The Netherlands - Market size and forecast 2025-2030 ($ million)
Chart on The Netherlands - Year-over-year growth 2025-2030 (%)
Data Table on The Netherlands - Year-over-year growth 2025-2030 (%)

12.6 South America - Market size and forecast 2025-2030

Chart on South America - Market size and forecast 2025-2030 ($ million)
Data Table on South America - Market size and forecast 2025-2030 ($ million)
Chart on South America - Year-over-year growth 2025-2030 (%)
Data Table on South America - Year-over-year growth 2025-2030 (%)
Chart on Regional Comparison - South America
Data Table on Regional Comparison - South America

12.6.1 Brazil - Market size and forecast 2025-2030

Chart on Brazil - Market size and forecast 2025-2030 ($ million)
Data Table on Brazil - Market size and forecast 2025-2030 ($ million)
Chart on Brazil - Year-over-year growth 2025-2030 (%)
Data Table on Brazil - Year-over-year growth 2025-2030 (%)

12.6.2 Argentina - Market size and forecast 2025-2030

Chart on Argentina - Market size and forecast 2025-2030 ($ million)
Data Table on Argentina - Market size and forecast 2025-2030 ($ million)
Chart on Argentina - Year-over-year growth 2025-2030 (%)
Data Table on Argentina - Year-over-year growth 2025-2030 (%)

12.6.3 Chile - Market size and forecast 2025-2030

Chart on Chile - Market size and forecast 2025-2030 ($ million)
Data Table on Chile - Market size and forecast 2025-2030 ($ million)
Chart on Chile - Year-over-year growth 2025-2030 (%)
Data Table on Chile - Year-over-year growth 2025-2030 (%)

12.7 Middle East and Africa - Market size and forecast 2025-2030

Chart on Middle East and Africa - Market size and forecast 2025-2030 ($ million)
Data Table on Middle East and Africa - Market size and forecast 2025-2030 ($ million)
Chart on Middle East and Africa - Year-over-year growth 2025-2030 (%)
Data Table on Middle East and Africa - Year-over-year growth 2025-2030 (%)
Chart on Regional Comparison - Middle East and Africa
Data Table on Regional Comparison - Middle East and Africa

12.7.1 Saudi Arabia - Market size and forecast 2025-2030

Chart on Saudi Arabia - Market size and forecast 2025-2030 ($ million)
Data Table on Saudi Arabia - Market size and forecast 2025-2030 ($ million)
Chart on Saudi Arabia - Year-over-year growth 2025-2030 (%)
Data Table on Saudi Arabia - Year-over-year growth 2025-2030 (%)

12.7.2 UAE - Market size and forecast 2025-2030

Chart on UAE - Market size and forecast 2025-2030 ($ million)
Data Table on UAE - Market size and forecast 2025-2030 ($ million)
Chart on UAE - Year-over-year growth 2025-2030 (%)
Data Table on UAE - Year-over-year growth 2025-2030 (%)

12.7.3 South Africa - Market size and forecast 2025-2030

Chart on South Africa - Market size and forecast 2025-2030 ($ million)
Data Table on South Africa - Market size and forecast 2025-2030 ($ million)
Chart on South Africa - Year-over-year growth 2025-2030 (%)
Data Table on South Africa - Year-over-year growth 2025-2030 (%)

12.7.4 Turkey - Market size and forecast 2025-2030

Chart on Turkey - Market size and forecast 2025-2030 ($ million)
Data Table on Turkey - Market size and forecast 2025-2030 ($ million)
Chart on Turkey - Year-over-year growth 2025-2030 (%)
Data Table on Turkey - Year-over-year growth 2025-2030 (%)

12.7.5 Israel - Market size and forecast 2025-2030

Chart on Israel - Market size and forecast 2025-2030 ($ million)
Data Table on Israel - Market size and forecast 2025-2030 ($ million)
Chart on Israel - Year-over-year growth 2025-2030 (%)
Data Table on Israel - Year-over-year growth 2025-2030 (%)

12.8 Market opportunity by geography

Market opportunity by geography ($ million)
Data Tables on Market opportunity by geography ($ million)

13. Drivers, Challenges, and Opportunity

13.1 Market drivers

Structural expansion of gaming sector and demand for high-refresh displays
Strategic mainstreaming of AI-enhanced upscaling and intelligent content processing
Increase of high-bandwidth streaming and 5G-enabled content delivery

13.2 Market challenges

Technical debt of content parity and hardware obsolescence cycles
Persistence of pricing elasticity and high manufacturing capital expenditure
Intensification of regulatory constraints regarding energy and sustainability

13.3 Impact of drivers and challenges

Impact of drivers and challenges in 2025 and 2030

13.4 Market opportunities

Inclusion of generative artificial intelligence and cognitive vision processing
Growth of RGB tandem OLED and mini-LED backlighting architectures
Expansion of ultra-thin aesthetics and wireless connectivity ecosystems

14. Competitive Landscape

14.1 Overview

14.2

Overview on criticality of inputs and factors of differentiation

14.3 Landscape disruption

Overview on factors of disruption

14.4 Industry risks

Impact of key risks on business

15. Competitive Analysis

15.1 Companies profiled

Companies covered

15.2 Company ranking index

15.3 Market positioning of companies

Matrix on companies position and classification

15.4 Haier Smart Home Co. Ltd.

Haier Smart Home Co. Ltd. - Overview
Haier Smart Home Co. Ltd. - Business segments
Haier Smart Home Co. Ltd. - Key offerings
Haier Smart Home Co. Ltd. - Segment focus
SWOT

15.5 Hisense International Co. Ltd.

Hisense International Co. Ltd. - Overview
Hisense International Co. Ltd. - Product / Service
Hisense International Co. Ltd. - Key offerings
SWOT

15.6 Koninklijke Philips NV

Koninklijke Philips NV - Overview
Koninklijke Philips NV - Business segments
Koninklijke Philips NV - Key news
Koninklijke Philips NV - Key offerings
Koninklijke Philips NV - Segment focus
SWOT

15.7 LG Electronics Inc.

LG Electronics Inc. - Overview
LG Electronics Inc. - Business segments
LG Electronics Inc. - Key offerings
LG Electronics Inc. - Segment focus
SWOT

15.8 OnePlus Technology Co. Ltd.

OnePlus Technology Co. Ltd. - Overview
OnePlus Technology Co. Ltd. - Product / Service
OnePlus Technology Co. Ltd. - Key offerings
SWOT

15.9 Panasonic Holdings Corp.

Panasonic Holdings Corp. - Overview
Panasonic Holdings Corp. - Business segments
Panasonic Holdings Corp. - Key news
Panasonic Holdings Corp. - Key offerings
Panasonic Holdings Corp. - Segment focus
SWOT

15.10 Samsung Electronics Co. Ltd.

Samsung Electronics Co. Ltd. - Overview
Samsung Electronics Co. Ltd. - Business segments
Samsung Electronics Co. Ltd. - Key news
Samsung Electronics Co. Ltd. - Key offerings
Samsung Electronics Co. Ltd. - Segment focus
SWOT

15.11 Sharp Corp.

Sharp Corp. - Overview
Sharp Corp. - Business segments
Sharp Corp. - Key offerings
Sharp Corp. - Segment focus
SWOT

15.12 Skyworth Group Ltd.

Skyworth Group Ltd. - Overview
Skyworth Group Ltd. - Business segments
Skyworth Group Ltd. - Key offerings
Skyworth Group Ltd. - Segment focus
SWOT

15.13 Sony Group Corp.

Sony Group Corp. - Overview
Sony Group Corp. - Business segments
Sony Group Corp. - Key news
Sony Group Corp. - Key offerings
Sony Group Corp. - Segment focus
SWOT

15.14 TCL Industries Holdings Ltd.

TCL Industries Holdings Ltd. - Overview
TCL Industries Holdings Ltd. - Business segments
TCL Industries Holdings Ltd. - Key news
TCL Industries Holdings Ltd. - Key offerings
TCL Industries Holdings Ltd. - Segment focus
SWOT

15.15 Toshiba Corp.

Toshiba Corp. - Overview
Toshiba Corp. - Product / Service
Toshiba Corp. - Key offerings
SWOT

15.16 VIZIO Holding Corp.

VIZIO Holding Corp. - Overview
VIZIO Holding Corp. - Business segments
VIZIO Holding Corp. - Key offerings
VIZIO Holding Corp. - Segment focus
SWOT

15.17 Vu Technologies Pvt. Ltd.

Vu Technologies Pvt. Ltd. - Overview
Vu Technologies Pvt. Ltd. - Product / Service
Vu Technologies Pvt. Ltd. - Key offerings
SWOT

15.18 Xiaomi Corp.

Xiaomi Corp. - Overview
Xiaomi Corp. - Business segments
Xiaomi Corp. - Key offerings
Xiaomi Corp. - Segment focus
SWOT

16. Appendix

16.1 Scope of the report

Market definition
Objectives
Notes and caveats

16.2 Inclusions and exclusions checklist

Inclusions checklist
Exclusions checklist

16.3 Currency conversion rates for US$

16.4 Research methodology

16.5 Data procurement

Information sources

16.6 Data validation

16.7 Validation techniques employed for market sizing

16.8 Data synthesis

16.9 360 degree market analysis

16.10 List of abbreviations

Research Methodology

Technavio presents a detailed picture of the market by way of study, synthesis, and summation of data from multiple sources. The analysts have presented the various facets of the market with a particular focus on identifying the key industry influencers. The data thus presented is comprehensive, reliable, and the result of extensive research, both primary and secondary.

INFORMATION SOURCES

Primary sources

  • Manufacturers and suppliers
  • Channel partners
  • Industry experts
  • Strategic decision makers

Secondary sources

  • Industry journals and periodicals
  • Government data
  • Financial reports of key industry players
  • Historical data
  • Press releases

DATA ANALYSIS

Data Synthesis

  • Collation of data
  • Estimation of key figures
  • Analysis of derived insights

Data Validation

  • Triangulation with data models
  • Reference against proprietary databases
  • Corroboration with industry experts

REPORT WRITING

Qualitative

  • Market drivers
  • Market challenges
  • Market trends
  • Five forces analysis

Quantitative

  • Market size and forecast
  • Market segmentation
  • Geographical insights
  • Competitive landscape

Interested in this report?

Get your sample now to see our research methodology and insights!

Download Now

Frequently Asked Questions

4K2K Tv market growth will increase by USD 19234.6 million during 2026-2030.

The 4K2K Tv market is expected to grow at a CAGR of 6% during 2026-2030.

4K2K Tv market is segmented by Display size (60 to 69 inches, 50 to 59 inches, Less than 49 inches, 70 to 79 inches, 80 and above) Distribution channel (Offline, Online) Application (Household, Commercial)

Element Electronics Holdings LLC, Funai Electric Co. Ltd., Grundig Intermedia GmbH, Haier Smart Home Co. Ltd., Hisense International Co. Ltd., Koninklijke Philips NV, LG Electronics Inc., OnePlus Technology Co. Ltd., Panasonic Holdings Corp., Realme Chongqing Mobile Corp., Samsung Electronics Co. Ltd., Sharp Corp., Skyworth Group Ltd., Sony Group Corp., TCL Industries Holdings Ltd., Toshiba Corp., TPV Technology Co. Ltd., VIZIO Holding Corp., Vu Technologies Pvt. Ltd., Xiaomi Corp. are a few of the key vendors in the 4K2K Tv market.

APAC will register the highest growth rate of 49.8% among the other regions. Therefore, the 4K2K Tv market in APAC is expected to garner significant business opportunities for the vendors during the forecast period.

China, India, Japan, South Korea, Indonesia, Australia, US, Canada, Mexico, Germany, UK, France, Italy, Spain, The Netherlands, Brazil, Argentina, Chile, Saudi Arabia, UAE, South Africa, Turkey, Israel

  • Structural expansion of gaming sector and demand for high-refresh displays is the driving factor this market.

The 4K2K Tv market vendors should focus on grabbing business opportunities from the Display size segment as it accounted for the largest market share in the base year.
RIA - Research AI Assistant
Ask RIA