21700 Lithium-ion Battery Market Analysis, Size, and Forecast 2026-2030: APAC (China, India, and South Korea), Europe (Germany, UK, and France), North America (US, Canada, and Mexico), South America (Brazil and Argentina), Middle East and Africa (Saudi Arabia, UAE, and South Africa), and Rest of World (ROW)

21700 Lithium-ion Battery Market Analysis, Size, and Forecast 2026-2030:
APAC (China, India, and South Korea), Europe (Germany, UK, and France), North America (US, Canada, and Mexico), South America (Brazil and Argentina), Middle East and Africa (Saudi Arabia, UAE, and South Africa), and Rest of World (ROW)

Published: May 2026 296 Pages SKU: IRTNTR73221

Market Overview at a Glance

$12.25 B
Market Opportunity
25.8%
CAGR 2025 - 2030
50.8%
APAC Growth
$3.54 B
Automotive segment 2024

21700 Lithium-ion Battery Market Size 2026-2030

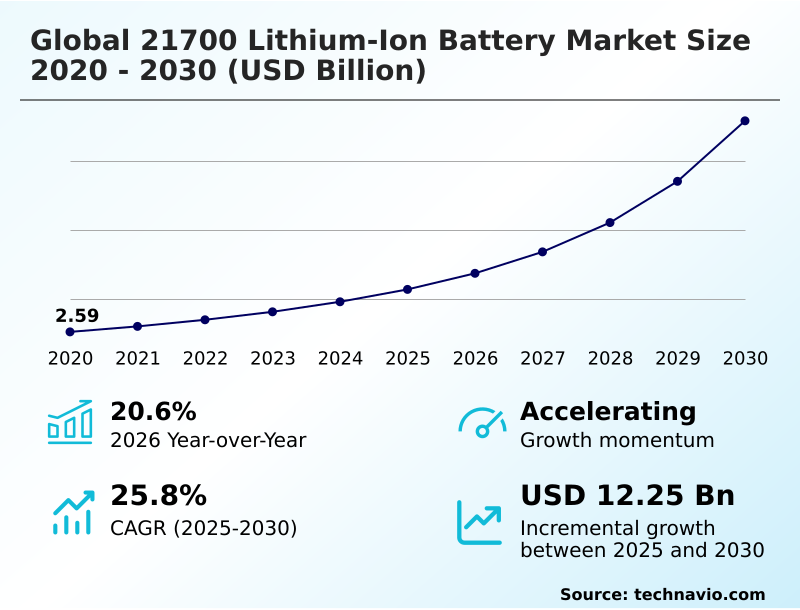
The 21700 Lithium-ion Battery Market size was valued at USD 5.68 billion in 2025, growing at a CAGR of 25.8% during the forecast period 2026-2030.

Major Market Trends & Insights

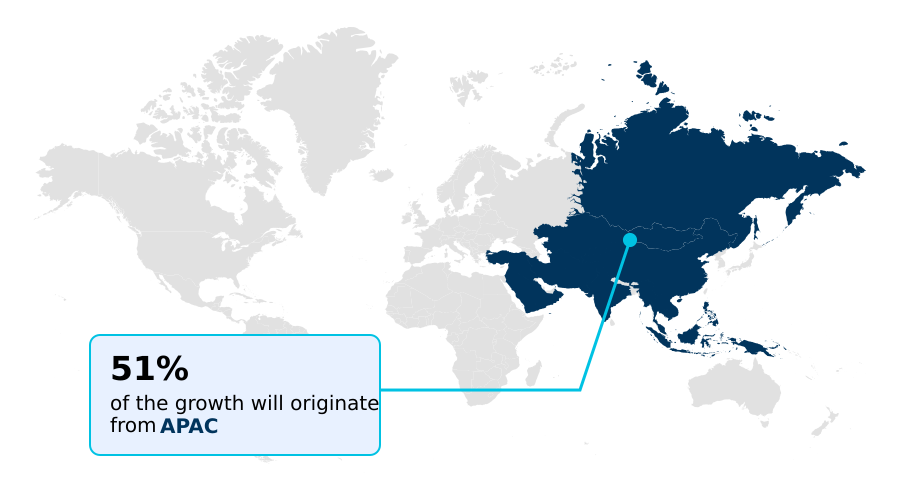
  • APAC dominated the market and accounted for a 50.8% growth during the forecast period.
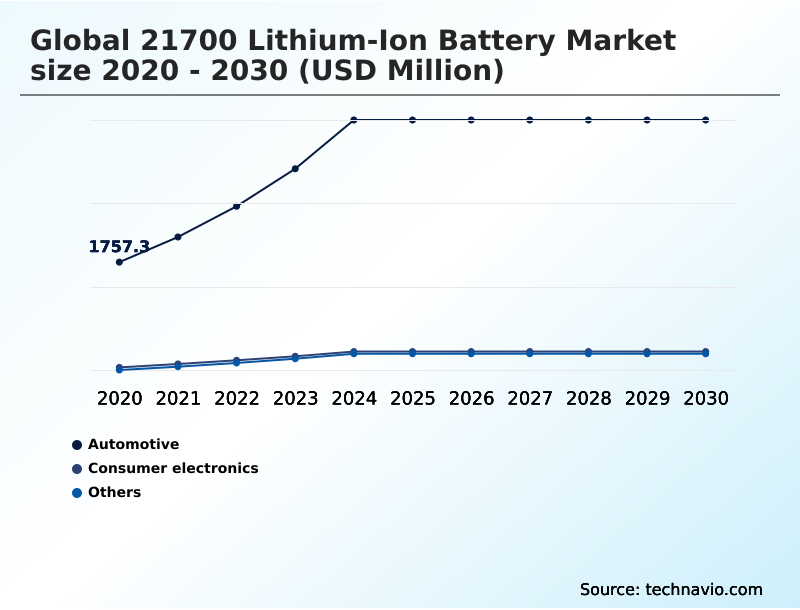
  • By Application - Automotive segment was valued at USD 3.54 billion in 2024
  • By Type - Lithium nickel manganese cobalt segment accounted for the largest market revenue share in 2024

Market Size & Forecast

  • Historic Market Opportunities 2020-2024: USD 15.34 billion
  • Market Future Opportunities 2025-2030: USD 12.25 billion
  • CAGR from 2025 to 2030 : 25.8%

Market Summary

  • The 21700 lithium-ion battery market is defined by a rapid transition to higher energy density formats, with modern cells offering up to 20% more capacity than the legacy 18650 standard.
  • This performance gain directly impacts product design in the automotive sector, where an EV manufacturer can now reduce the number of cells in a battery pack by 15%, lowering both weight and assembly complexity. A primary driver is the declining cost of lithium-ion technology, which expands its viability into new applications.
  • However, the market faces a significant challenge from supply chain bottlenecks for critical raw materials like high-purity lithium and cobalt, which can disrupt production schedules and increase cost volatility. The continuous innovation in cathode materials and anode powders is essential for overcoming these hurdles and meeting the escalating demand from electric vehicles and large-scale energy storage systems.

What will be the Size of the 21700 Lithium-ion Battery Market during the forecast period?

Get Key Insights on Market Forecast (PDF) Request Free Sample

How is the 21700 Lithium-ion Battery Market Segmented?

The 21700 lithium-ion battery industry research report provides comprehensive data (region-wise segment analysis), with forecasts and analysis for the period 2026-2030, as well as historical data from 2020-2024 for the following segments.

  • Application
    • Automotive
    • Consumer electronics
    • Others
  • Type
    • Lithium nickel manganese cobalt
    • Lithium titanate
    • Lithium iron phosphate
    • Lithium cobalt oxide
  • Distribution channel
    • Offline
    • Online
  • Geography
    • APAC
      • China
      • India
      • South Korea
    • Europe
      • Germany
      • UK
      • France
    • North America
      • US
      • Canada
      • Mexico
    • South America
      • Brazil
      • Argentina
    • Middle East and Africa
      • Saudi Arabia
      • UAE
      • South Africa
    • Rest of World (ROW)

How is the 21700 Lithium-ion Battery Market Segmented by Application?

The automotive segment is estimated to witness significant growth during the forecast period.

The automotive segment's market dominance is driven by the 21700 format's ability to reduce battery pack complexity by up to 15% due to its higher individual cell capacity.

This improved cylindrical cell architecture, often utilizing advanced lithium nickel manganese cobalt chemistry, delivers a 20% greater energy density than legacy formats, which directly extends electric vehicle driving range.

The adoption of these high-energy-density cells simplifies battery management system engineering and enhances overall vehicle reliability.

Consequently, this format has become the preferred choice for global OEMs seeking to balance performance, cost, and manufacturing scalability in next-generation electric mobility platforms, where thermal stability and fast charging capabilities are critical.

Request Free Sample

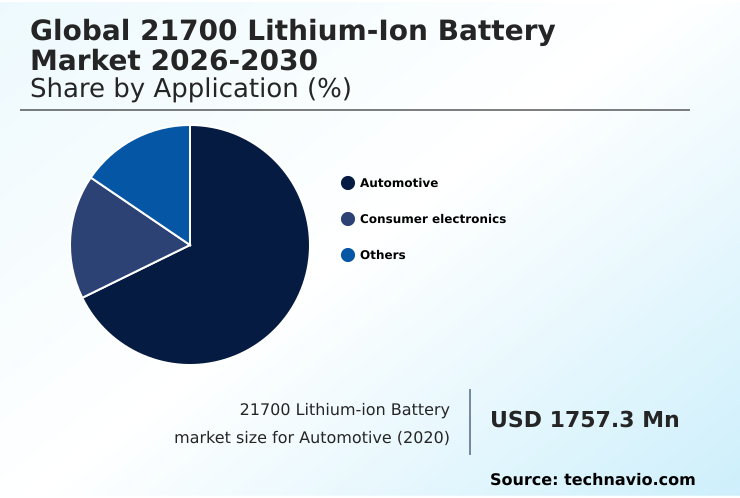
The Automotive segment was valued at USD 3.54 billion in 2024 and showed a gradual increase during the forecast period.

Request Free Sample

How demand for the 21700 Lithium-ion Battery market is rising in the leading region?

APAC is estimated to contribute 50.8% to the growth of the global market during the forecast period.Technavio’s analysts have elaborately explained the regional trends and drivers that shape the market during the forecast period.

See How 21700 Lithium-ion Battery Market demand is rising in APAC Request Free Sample

The geographic landscape of the 21700 lithium-ion battery market is dominated by APAC, which accounts for over 50% of the global market opportunity, significantly outpacing Europe at 34.1%.

This leadership is anchored by a deeply integrated manufacturing ecosystem in countries like China, which represents a market value of 1,462 million, supported by extensive raw material sourcing and high-volume production efficiency.

In contrast, North America's strategy focuses on building supply chain resilience through localized production, incentivized by government policies aimed at reducing dependence on imports by over 40%.

This regional divergence influences everything from battery pack architecture to cost structures, as European and North American markets prioritize vehicle-to-grid technology and circular economy principles, while APAC continues to lead in scale and speed of innovation for high-energy-density cells.

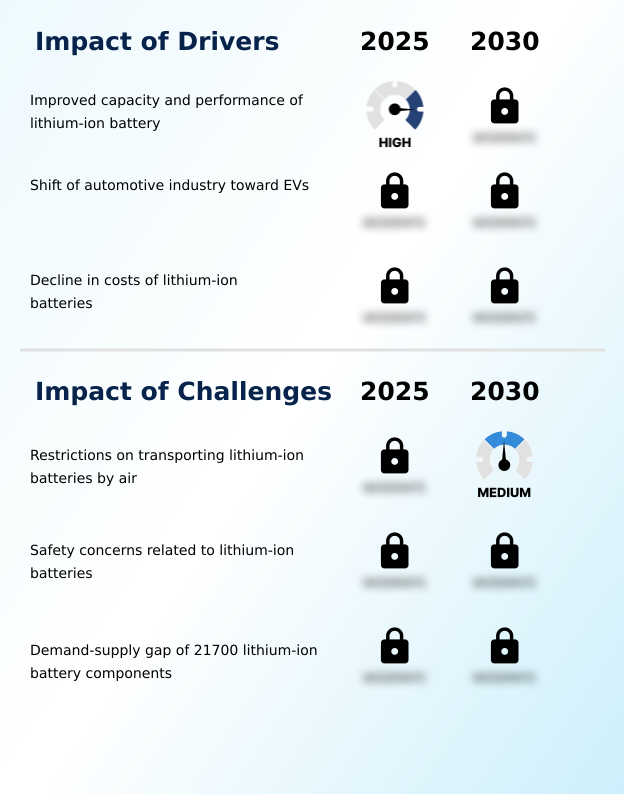
What are the key Drivers, Trends, and Challenges in the 21700 Lithium-ion Battery Market?

Our researchers analyzed the data with 2025 as the base year, along with the key drivers, trends, and challenges. A holistic analysis of drivers will help companies refine their marketing strategies to gain a competitive advantage.

  • The ongoing debate over 21700 battery vs 18650 energy density is decisively settling, with the 21700 format consistently delivering up to 20% more capacity, fundamentally altering battery pack design in electric vehicles.
  • This advantage drives intense research into improving 21700 lithium-ion battery cycle life, where advancements in cathode materials are extending operational longevity by over 30%, a critical factor for both consumer electronics and energy storage systems.
  • Effective thermal management for 21700 battery packs has become a key area of innovation, as superior heat dissipation is essential for enabling fast charging and ensuring safety by mitigating thermal runaway risks.
  • The choice between 21700 LFP vs NMC for EVs illustrates a key market bifurcation; LFP is favored for standard-range models due to its lower cost and enhanced safety, while NMC is reserved for high-performance vehicles requiring maximum energy density.
  • Addressing 21700 cell manufacturing process challenges, such as maintaining high-speed electrode coating uniformity and minimizing defects, remains a primary focus for achieving cost-per-kilowatt-hour reductions. The future of 21700 battery technology appears to be centered on integrating silicon-graphite anodes and solid-state electrolytes to push performance boundaries even further.

What are the key market drivers leading to the rise in the adoption of 21700 Lithium-ion Battery Industry?

  • The market's growth is primarily driven by the continuous improvement in the capacity and performance of lithium-ion batteries.

  • A significant decline in the cost per kilowatt-hour, which has dropped by over 80% in the last decade, is a primary driver fueling the widespread adoption of 21700 lithium-ion batteries.
  • This cost reduction is the result of massive economies of scale in automated manufacturing, driven largely by the booming electric vehicle market.
  • Lower prices have expanded the technology's accessibility, making it a viable power source for a wider range of consumer electronics and industrial applications.
  • This increased affordability enhances production efficiency for downstream manufacturers and accelerates the overall transition toward electrified systems, reinforcing the demand for high-performance and reliable energy storage systems.

What are the market trends shaping the 21700 Lithium-ion Battery Industry?

  • The rise in battery recycling initiatives is emerging as a significant market trend, reshaping supply chain economics and promoting a circular economy for critical materials.

  • The market is experiencing a definitive shift toward higher energy density cells, a trend driven by commercial demand for longer-lasting and more powerful devices. This transition enables performance gains of 15-20% in energy capacity compared to older formats, directly benefiting applications from power tools to electric vehicles.
  • As a result, manufacturers are redesigning battery pack architecture to be more compact and efficient. This trend also accelerates the importance of developing a robust circular economy to manage end-of-life recovery for these advanced cells, ensuring the sustainability of raw material sourcing. The focus on improving cycle life and thermal stability remains paramount as cell capacity increases.

What challenges does the 21700 Lithium-ion Battery Industry face during its growth?

  • Stringent restrictions on the transportation of lithium-ion batteries by air present a key challenge, impacting global supply chain logistics and delivery timelines.

  • Safety concerns, particularly the risk of thermal runaway in high-energy-density cells, remain a persistent challenge that can increase the cost of battery management systems by up to 25%. Mitigating this risk requires significant investment in advanced quality control measures and sophisticated thermal management technologies, creating high barriers for new entrants.
  • Furthermore, these safety standards place intense pressure on supply chain resilience, as manufacturers must ensure the purity and consistency of raw materials like cathode powders and separators. Navigating these safety and supply chain complexities is critical for maintaining market access and consumer trust in all applications.

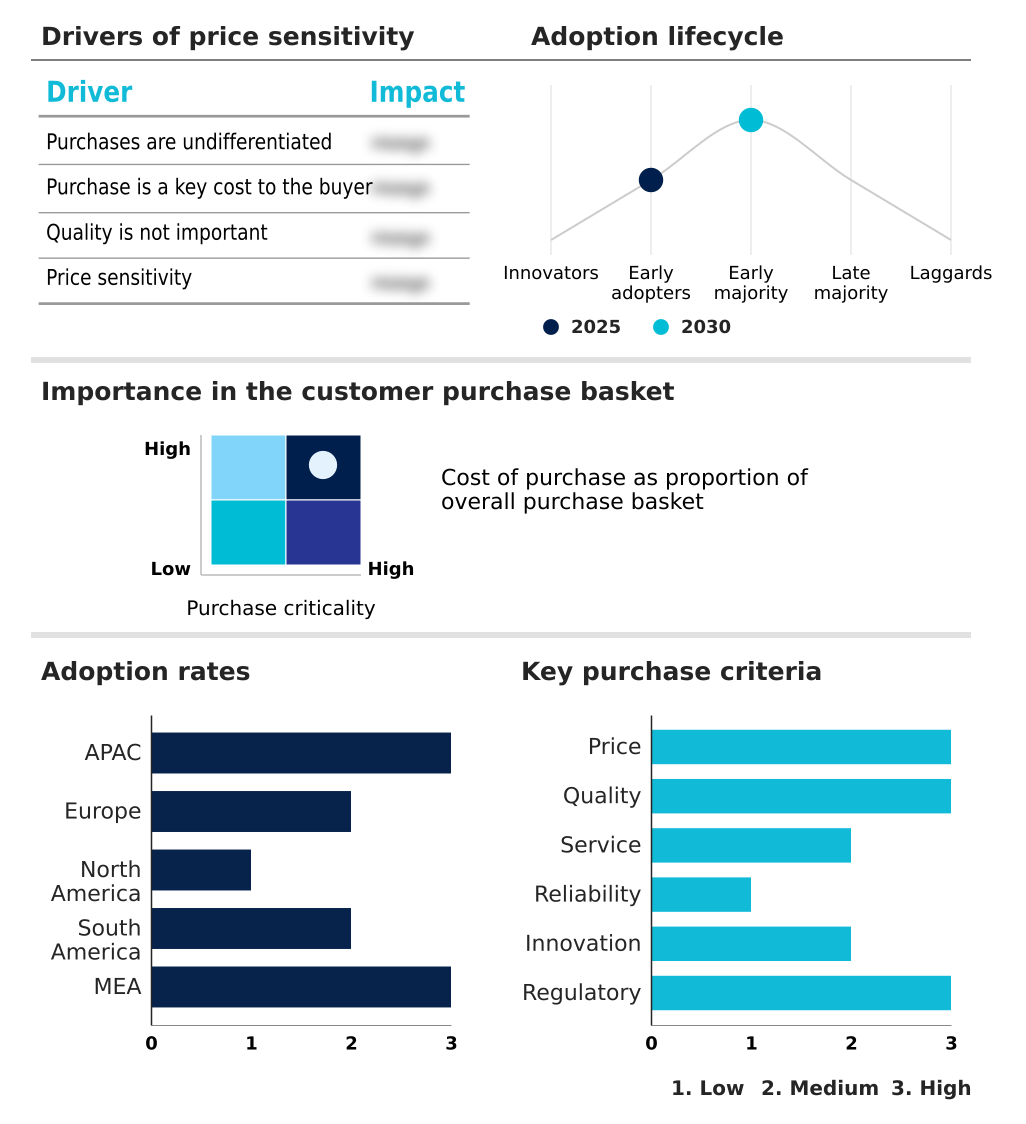
Exclusive Technavio Analysis on Customer Landscape

The 21700 lithium-ion battery market forecasting report includes the adoption lifecycle of the market, covering from the innovator’s stage to the laggard’s stage. It focuses on adoption rates in different regions based on penetration. Furthermore, the 21700 lithium-ion battery market report also includes key purchase criteria and drivers of price sensitivity to help companies evaluate and develop their market growth analysis strategies.

Customer Landscape of 21700 Lithium-ion Battery Industry

Competitive Landscape

Companies are implementing various strategies, such as strategic alliances, 21700 lithium-ion battery market forecast, partnerships, mergers and acquisitions, geographical expansion, and product/service launches, to enhance their presence in the industry.

Ace Battery Co. Ltd. - Key offerings include high-performance cylindrical cells and integrated battery systems for electric mobility, energy storage, and high-drain industrial applications.

The industry research and growth report includes detailed analyses of the competitive landscape of the market and information about key companies, including:

  • Ace Battery Co. Ltd.
  • CBAK Energy Technology Inc.
  • Cham Battery Technology Co.
  • DLG Battery Co. Ltd.
  • E One Moli Energy Corp.
  • EVE Energy Co. Ltd.
  • Godi India Pvt. Ltd.
  • Howell Energy Co. Ltd.
  • Jiangsu Highstar Battery Co.
  • LG Energy Solution Ltd.
  • Murata Manufacturing Co. Ltd.
  • Nanotech Energy Inc.
  • Panasonic Holdings Corp.
  • Samsung SDI Co. Ltd.
  • Shenzhen BAK Battery Co. Ltd.
  • Shenzhen Sinowatt Power Co.
  • Sunwoda Electronic Co. Ltd.
  • Tenpower Supply Co. Ltd.
  • TianJin Lishen Battery Ltd.
  • Ufine Technology Co. Ltd.

Qualitative and quantitative analysis of companies has been conducted to help clients understand the wider business environment as well as the strengths and weaknesses of key industry players. Data is qualitatively analyzed to categorize companies as pure play, category-focused, industry-focused, and diversified; it is quantitatively analyzed to categorize companies as dominant, leading, strong, tentative, and weak.

Market Intelligence Radar: High-Impact Developments & Growth Signals

  • In the Renewable Electricity industry, supportive government policies mandating renewable power deployment have accelerated the need for grid-scale energy storage systems, directly boosting demand for 21700 lithium-ion batteries in modular ESS and promoting vehicle-to-grid integration.
  • The declining levelized cost of electricity from solar and wind sources has made them more economical than many fossil fuels, increasing the necessity for cost-effective battery storage and favoring the 21700 format due to its falling cost per kilowatt-hour and high production efficiency.
  • A focus on grid resilience and a shift from centralized power generation are driving the adoption of microgrids and distributed energy resources, which creates new applications for 21700-based battery packs in both residential and commercial settings, thereby enhancing supply chain resilience.
  • The global change in the energy mix toward renewables to meet decarbonization goals is fundamentally expanding the total addressable market for energy storage, with 21700 cells being a key technology for both automated manufacturing and stationary storage.

Dive into Technavio’s robust research methodology, blending expert interviews, extensive data synthesis, and validated models for unparalleled 21700 Lithium-ion Battery Market insights. See full methodology.

Market Scope
Page number 296
Base year 2025
Historic period 2020-2024
Forecast period 2026-2030
Growth momentum & CAGR Accelerate at a CAGR of 25.8%
Market growth 2026-2030 USD 12254.8 million
Market structure Fragmented
YoY growth 2025-2026(%) 20.6%
Key countries China, India, South Korea, Japan, Australia, Indonesia, Germany, UK, France, Italy, Spain, The Netherlands, US, Canada, Mexico, Brazil, Argentina, Chile, Saudi Arabia, UAE, South Africa, Israel and Turkey
Competitive landscape Leading Companies, Market Positioning of Companies, Competitive Strategies, and Industry Risks

Request Free Sample

Research Analyst Overview

  • The 21700 lithium-ion battery market ecosystem is a complex value chain that begins with a concentrated group of raw material suppliers providing lithium, nickel, and cobalt, whose pricing volatility can impact final product costs by up to 40%. These materials are processed by cathode and anode powder manufacturers before reaching cell producers, who operate large-scale automated manufacturing facilities.
  • The manufactured cylindrical cells are then sold through direct and distributed channels to OEMs in the electric vehicle, power tool, and consumer electronics sectors. Regulatory bodies impose stringent safety standards for transport and use, adding a layer of compliance complexity.
  • Supporting this ecosystem are R&D institutions focused on advancing cell capacity and cycle life, with a 15% improvement in energy density being a key competitive benchmark.

What are the Key Data Covered in this 21700 Lithium-ion Battery Market Research and Growth Report?

  • What is the expected growth of the 21700 Lithium-ion Battery Market between 2026 and 2030?

    • The 21700 Lithium-ion Battery Market is expected to grow by USD 12.25 billion during 2026-2030, registering a CAGR of 25.8%. Year-over-year growth in 2026 is estimated at 20.6%%. This acceleration is shaped by improved capacity and performance of lithium-ion battery, which is intensifying demand across multiple end-use verticals covered in the report.

  • What segmentation does the market report cover?

    • The report is segmented by Application (Automotive, Consumer electronics, and Others), Type (Lithium nickel manganese cobalt, Lithium titanate, Lithium iron phosphate, and Lithium cobalt oxide), Distribution Channel (Offline, and Online) and Geography (APAC, Europe, North America, South America, Middle East and Africa). Among these, the Automotive segment is estimated to witness significant growth during the forecast period, driven by rising adoption across key application areas. Each segment includes detailed qualitative and quantitative analysis, along with historical data from 2020-2024 and forecasts through 2030 with year-over-year growth rates.

  • Which regions are analyzed in the report?

    • The report covers APAC, Europe, North America, South America and Middle East and Africa. APAC is estimated to contribute 50.8% to market growth during the forecast period. Country-level analysis includes China, India, South Korea, Japan, Australia, Indonesia, Germany, UK, France, Italy, Spain, The Netherlands, US, Canada, Mexico, Brazil, Argentina, Chile, Saudi Arabia, UAE, South Africa, Israel and Turkey, with dedicated market size tables and year-over-year growth for each.

  • What are the key growth drivers and market challenges?

    • The primary driver is improved capacity and performance of lithium-ion battery, which is accelerating investment and industry demand. The main challenge is restrictions on transporting lithium-ion batteries by air, creating operational barriers for key market participants. The report quantifies the impact of each driver and challenge across 2026 and 2030 with comparative analysis.

  • Who are the major players in the 21700 Lithium-ion Battery Market?

    • Key vendors include Ace Battery Co. Ltd., CBAK Energy Technology Inc., Cham Battery Technology Co., DLG Battery Co. Ltd., E One Moli Energy Corp., EVE Energy Co. Ltd., Godi India Pvt. Ltd., Howell Energy Co. Ltd., Jiangsu Highstar Battery Co., LG Energy Solution Ltd., Murata Manufacturing Co. Ltd., Nanotech Energy Inc., Panasonic Holdings Corp., Samsung SDI Co. Ltd., Shenzhen BAK Battery Co. Ltd., Shenzhen Sinowatt Power Co., Sunwoda Electronic Co. Ltd., Tenpower Supply Co. Ltd., TianJin Lishen Battery Ltd. and Ufine Technology Co. Ltd.. The report provides qualitative and quantitative analysis categorizing companies as dominant, leading, strong, tentative, and weak based on their market positioning. Company profiles include business segment analysis, SWOT assessment, key offerings, and recent strategic developments.

Market Research Insights

  • The competitive landscape for the 21700 lithium-ion battery is highly concentrated, with the top three manufacturers commanding over 60% of the market share. In response to surging demand from the electric vehicle sector, key players are aggressively expanding their manufacturing footprint.
  • For instance, companies like LG Energy Solution and Panasonic are scaling up production, with new facilities designed to increase output by more than 30% to serve North American and European automotive OEMs. This expansion is directly tied to the industry's shift toward localized supply chains to mitigate geopolitical risks and reduce logistics costs.
  • While vendors are heavily investing in R&D to improve energy density and fast charging capabilities, they concurrently face the challenge of securing long-term contracts for raw materials amid volatile pricing and increasing competition.

We can help! Our analysts can customize this 21700 lithium-ion battery market research report to meet your requirements.

Get in touch

1. Executive Summary

1.1 Market overview

Executive Summary - Chart on Market Overview
Executive Summary - Data Table on Market Overview
Executive Summary - Chart on Global Market Characteristics
Executive Summary - Chart on Market by Geography
Executive Summary - Chart on Market Segmentation by Application
Executive Summary - Chart on Market Segmentation by Type
Executive Summary - Chart on Market Segmentation by Distribution Channel
Executive Summary - Chart on Incremental Growth
Executive Summary - Data Table on Incremental Growth
Executive Summary - Chart on Company Market Positioning

2. Technavio Analysis

2.1 Analysis of price sensitivity, lifecycle, customer purchase basket, adoption rates, and purchase criteria

2.2 Criticality of inputs and Factors of differentiation

Chart on Overview on criticality of inputs and factors of differentiation

2.3 Factors of disruption

Chart on Overview on factors of disruption

2.4 Impact of drivers and challenges

Chart on Impact of drivers and challenges in 2025 and 2030

3. Market Landscape

3.1 Market ecosystem

Chart on Parent Market
Data Table on - Parent Market

3.2 Market characteristics

Chart on Market characteristics analysis

3.3 Value chain analysis

Chart on Value chain analysis

4. Market Sizing

4.1 Market definition

Data Table on Offerings of companies included in the market definition

4.2 Market segment analysis

Market segments

4.3 Market size 2025

4.4 Market outlook: Forecast for 2025-2030

Chart on Global - Market size and forecast 2025-2030 ($ million)
Data Table on Global - Market size and forecast 2025-2030 ($ million)
Chart on Global Market: Year-over-year growth 2025-2030 (%)
Data Table on Global Market: Year-over-year growth 2025-2030 (%)

5. Historic Market Size

5.1 Global 21700 Lithium-Ion Battery Market 2020 - 2024

Historic Market Size - Data Table on Global 21700 Lithium-Ion Battery Market 2020 - 2024 ($ million)

5.2 Application segment analysis 2020 - 2024

Historic Market Size - Application Segment 2020 - 2024 ($ million)

5.3 Type segment analysis 2020 - 2024

Historic Market Size - Type Segment 2020 - 2024 ($ million)

5.4 Distribution Channel segment analysis 2020 - 2024

Historic Market Size - Distribution Channel Segment 2020 - 2024 ($ million)

5.5 Geography segment analysis 2020 - 2024

Historic Market Size - Geography Segment 2020 - 2024 ($ million)

5.6 Country segment analysis 2020 - 2024

Historic Market Size - Country Segment 2020 - 2024 ($ million)

6. Qualitative Analysis

6.1 Impact of AI on the Global 21700 Lithium-Ion Battery Market

7. Five Forces Analysis

7.1 Five forces summary

Five forces analysis - Comparison between 2025 and 2030

7.2 Bargaining power of buyers

Bargaining power of buyers - Impact of key factors 2025 and 2030

7.3 Bargaining power of suppliers

Bargaining power of suppliers - Impact of key factors in 2025 and 2030

7.4 Threat of new entrants

Threat of new entrants - Impact of key factors in 2025 and 2030

7.5 Threat of substitutes

Threat of substitutes - Impact of key factors in 2025 and 2030

7.6 Threat of rivalry

Threat of rivalry - Impact of key factors in 2025 and 2030

7.7 Market condition

Chart on Market condition - Five forces 2025 and 2030

8. Market Segmentation by Application

8.1 Market segments

Chart on Application - Market share 2025-2030 (%)
Data Table on Application - Market share 2025-2030 (%)

8.2 Comparison by Application

Chart on Comparison by Application
Data Table on Comparison by Application

8.3 Automotive - Market size and forecast 2025-2030

Chart on Automotive - Market size and forecast 2025-2030 ($ million)
Data Table on Automotive - Market size and forecast 2025-2030 ($ million)
Chart on Automotive - Year-over-year growth 2025-2030 (%)
Data Table on Automotive - Year-over-year growth 2025-2030 (%)

8.4 Consumer electronics - Market size and forecast 2025-2030

Chart on Consumer electronics - Market size and forecast 2025-2030 ($ million)
Data Table on Consumer electronics - Market size and forecast 2025-2030 ($ million)
Chart on Consumer electronics - Year-over-year growth 2025-2030 (%)
Data Table on Consumer electronics - Year-over-year growth 2025-2030 (%)

8.5 Others - Market size and forecast 2025-2030

Chart on Others - Market size and forecast 2025-2030 ($ million)
Data Table on Others - Market size and forecast 2025-2030 ($ million)
Chart on Others - Year-over-year growth 2025-2030 (%)
Data Table on Others - Year-over-year growth 2025-2030 (%)

8.6 Market opportunity by Application

Market opportunity by Application ($ million)
Data Table on Market opportunity by Application ($ million)

9. Market Segmentation by Type

9.1 Market segments

Chart on Type - Market share 2025-2030 (%)
Data Table on Type - Market share 2025-2030 (%)

9.2 Comparison by Type

Chart on Comparison by Type
Data Table on Comparison by Type

9.3 Lithium nickel manganese cobalt - Market size and forecast 2025-2030

Chart on Lithium nickel manganese cobalt - Market size and forecast 2025-2030 ($ million)
Data Table on Lithium nickel manganese cobalt - Market size and forecast 2025-2030 ($ million)
Chart on Lithium nickel manganese cobalt - Year-over-year growth 2025-2030 (%)
Data Table on Lithium nickel manganese cobalt - Year-over-year growth 2025-2030 (%)

9.4 Lithium titanate - Market size and forecast 2025-2030

Chart on Lithium titanate - Market size and forecast 2025-2030 ($ million)
Data Table on Lithium titanate - Market size and forecast 2025-2030 ($ million)
Chart on Lithium titanate - Year-over-year growth 2025-2030 (%)
Data Table on Lithium titanate - Year-over-year growth 2025-2030 (%)

9.5 Lithium iron phosphate - Market size and forecast 2025-2030

Chart on Lithium iron phosphate - Market size and forecast 2025-2030 ($ million)
Data Table on Lithium iron phosphate - Market size and forecast 2025-2030 ($ million)
Chart on Lithium iron phosphate - Year-over-year growth 2025-2030 (%)
Data Table on Lithium iron phosphate - Year-over-year growth 2025-2030 (%)

9.6 Lithium cobalt oxide - Market size and forecast 2025-2030

Chart on Lithium cobalt oxide - Market size and forecast 2025-2030 ($ million)
Data Table on Lithium cobalt oxide - Market size and forecast 2025-2030 ($ million)
Chart on Lithium cobalt oxide - Year-over-year growth 2025-2030 (%)
Data Table on Lithium cobalt oxide - Year-over-year growth 2025-2030 (%)

9.7 Market opportunity by Type

Market opportunity by Type ($ million)
Data Table on Market opportunity by Type ($ million)

10. Market Segmentation by Distribution Channel

10.1 Market segments

Chart on Distribution Channel - Market share 2025-2030 (%)
Data Table on Distribution Channel - Market share 2025-2030 (%)

10.2 Comparison by Distribution Channel

Chart on Comparison by Distribution Channel
Data Table on Comparison by Distribution Channel

10.3 Offline - Market size and forecast 2025-2030

Chart on Offline - Market size and forecast 2025-2030 ($ million)
Data Table on Offline - Market size and forecast 2025-2030 ($ million)
Chart on Offline - Year-over-year growth 2025-2030 (%)
Data Table on Offline - Year-over-year growth 2025-2030 (%)

10.4 Online - Market size and forecast 2025-2030

Chart on Online - Market size and forecast 2025-2030 ($ million)
Data Table on Online - Market size and forecast 2025-2030 ($ million)
Chart on Online - Year-over-year growth 2025-2030 (%)
Data Table on Online - Year-over-year growth 2025-2030 (%)

10.5 Market opportunity by Distribution Channel

Market opportunity by Distribution Channel ($ million)
Data Table on Market opportunity by Distribution Channel ($ million)

11. Customer Landscape

11.1 Customer landscape overview

Analysis of price sensitivity, lifecycle, customer purchase basket, adoption rates, and purchase criteria

12. Geographic Landscape

12.1 Geographic segmentation

Chart on Market share by geography 2025-2030 (%)
Data Table on Market share by geography 2025-2030 (%)

12.2 Geographic comparison

Chart on Geographic comparison
Data Table on Geographic comparison

12.3 APAC - Market size and forecast 2025-2030

Chart on APAC - Market size and forecast 2025-2030 ($ million)
Data Table on APAC - Market size and forecast 2025-2030 ($ million)
Chart on APAC - Year-over-year growth 2025-2030 (%)
Data Table on APAC - Year-over-year growth 2025-2030 (%)
Chart on Regional Comparison - APAC
Data Table on Regional Comparison - APAC

12.3.1 China - Market size and forecast 2025-2030

Chart on China - Market size and forecast 2025-2030 ($ million)
Data Table on China - Market size and forecast 2025-2030 ($ million)
Chart on China - Year-over-year growth 2025-2030 (%)
Data Table on China - Year-over-year growth 2025-2030 (%)

12.3.2 India - Market size and forecast 2025-2030

Chart on India - Market size and forecast 2025-2030 ($ million)
Data Table on India - Market size and forecast 2025-2030 ($ million)
Chart on India - Year-over-year growth 2025-2030 (%)
Data Table on India - Year-over-year growth 2025-2030 (%)

12.3.3 South Korea - Market size and forecast 2025-2030

Chart on South Korea - Market size and forecast 2025-2030 ($ million)
Data Table on South Korea - Market size and forecast 2025-2030 ($ million)
Chart on South Korea - Year-over-year growth 2025-2030 (%)
Data Table on South Korea - Year-over-year growth 2025-2030 (%)

12.3.4 Japan - Market size and forecast 2025-2030

Chart on Japan - Market size and forecast 2025-2030 ($ million)
Data Table on Japan - Market size and forecast 2025-2030 ($ million)
Chart on Japan - Year-over-year growth 2025-2030 (%)
Data Table on Japan - Year-over-year growth 2025-2030 (%)

12.3.5 Australia - Market size and forecast 2025-2030

Chart on Australia - Market size and forecast 2025-2030 ($ million)
Data Table on Australia - Market size and forecast 2025-2030 ($ million)
Chart on Australia - Year-over-year growth 2025-2030 (%)
Data Table on Australia - Year-over-year growth 2025-2030 (%)

12.3.6 Indonesia - Market size and forecast 2025-2030

Chart on Indonesia - Market size and forecast 2025-2030 ($ million)
Data Table on Indonesia - Market size and forecast 2025-2030 ($ million)
Chart on Indonesia - Year-over-year growth 2025-2030 (%)
Data Table on Indonesia - Year-over-year growth 2025-2030 (%)

12.4 Europe - Market size and forecast 2025-2030

Chart on Europe - Market size and forecast 2025-2030 ($ million)
Data Table on Europe - Market size and forecast 2025-2030 ($ million)
Chart on Europe - Year-over-year growth 2025-2030 (%)
Data Table on Europe - Year-over-year growth 2025-2030 (%)
Chart on Regional Comparison - Europe
Data Table on Regional Comparison - Europe

12.4.1 Germany - Market size and forecast 2025-2030

Chart on Germany - Market size and forecast 2025-2030 ($ million)
Data Table on Germany - Market size and forecast 2025-2030 ($ million)
Chart on Germany - Year-over-year growth 2025-2030 (%)
Data Table on Germany - Year-over-year growth 2025-2030 (%)

12.4.2 UK - Market size and forecast 2025-2030

Chart on UK - Market size and forecast 2025-2030 ($ million)
Data Table on UK - Market size and forecast 2025-2030 ($ million)
Chart on UK - Year-over-year growth 2025-2030 (%)
Data Table on UK - Year-over-year growth 2025-2030 (%)

12.4.3 France - Market size and forecast 2025-2030

Chart on France - Market size and forecast 2025-2030 ($ million)
Data Table on France - Market size and forecast 2025-2030 ($ million)
Chart on France - Year-over-year growth 2025-2030 (%)
Data Table on France - Year-over-year growth 2025-2030 (%)

12.4.4 Italy - Market size and forecast 2025-2030

Chart on Italy - Market size and forecast 2025-2030 ($ million)
Data Table on Italy - Market size and forecast 2025-2030 ($ million)
Chart on Italy - Year-over-year growth 2025-2030 (%)
Data Table on Italy - Year-over-year growth 2025-2030 (%)

12.4.5 Spain - Market size and forecast 2025-2030

Chart on Spain - Market size and forecast 2025-2030 ($ million)
Data Table on Spain - Market size and forecast 2025-2030 ($ million)
Chart on Spain - Year-over-year growth 2025-2030 (%)
Data Table on Spain - Year-over-year growth 2025-2030 (%)

12.4.6 The Netherlands - Market size and forecast 2025-2030

Chart on The Netherlands - Market size and forecast 2025-2030 ($ million)
Data Table on The Netherlands - Market size and forecast 2025-2030 ($ million)
Chart on The Netherlands - Year-over-year growth 2025-2030 (%)
Data Table on The Netherlands - Year-over-year growth 2025-2030 (%)

12.5 North America - Market size and forecast 2025-2030

Chart on North America - Market size and forecast 2025-2030 ($ million)
Data Table on North America - Market size and forecast 2025-2030 ($ million)
Chart on North America - Year-over-year growth 2025-2030 (%)
Data Table on North America - Year-over-year growth 2025-2030 (%)
Chart on Regional Comparison - North America
Data Table on Regional Comparison - North America

12.5.1 US - Market size and forecast 2025-2030

Chart on US - Market size and forecast 2025-2030 ($ million)
Data Table on US - Market size and forecast 2025-2030 ($ million)
Chart on US - Year-over-year growth 2025-2030 (%)
Data Table on US - Year-over-year growth 2025-2030 (%)

12.5.2 Canada - Market size and forecast 2025-2030

Chart on Canada - Market size and forecast 2025-2030 ($ million)
Data Table on Canada - Market size and forecast 2025-2030 ($ million)
Chart on Canada - Year-over-year growth 2025-2030 (%)
Data Table on Canada - Year-over-year growth 2025-2030 (%)

12.5.3 Mexico - Market size and forecast 2025-2030

Chart on Mexico - Market size and forecast 2025-2030 ($ million)
Data Table on Mexico - Market size and forecast 2025-2030 ($ million)
Chart on Mexico - Year-over-year growth 2025-2030 (%)
Data Table on Mexico - Year-over-year growth 2025-2030 (%)

12.6 South America - Market size and forecast 2025-2030

Chart on South America - Market size and forecast 2025-2030 ($ million)
Data Table on South America - Market size and forecast 2025-2030 ($ million)
Chart on South America - Year-over-year growth 2025-2030 (%)
Data Table on South America - Year-over-year growth 2025-2030 (%)
Chart on Regional Comparison - South America
Data Table on Regional Comparison - South America

12.6.1 Brazil - Market size and forecast 2025-2030

Chart on Brazil - Market size and forecast 2025-2030 ($ million)
Data Table on Brazil - Market size and forecast 2025-2030 ($ million)
Chart on Brazil - Year-over-year growth 2025-2030 (%)
Data Table on Brazil - Year-over-year growth 2025-2030 (%)

12.6.2 Argentina - Market size and forecast 2025-2030

Chart on Argentina - Market size and forecast 2025-2030 ($ million)
Data Table on Argentina - Market size and forecast 2025-2030 ($ million)
Chart on Argentina - Year-over-year growth 2025-2030 (%)
Data Table on Argentina - Year-over-year growth 2025-2030 (%)

12.6.3 Chile - Market size and forecast 2025-2030

Chart on Chile - Market size and forecast 2025-2030 ($ million)
Data Table on Chile - Market size and forecast 2025-2030 ($ million)
Chart on Chile - Year-over-year growth 2025-2030 (%)
Data Table on Chile - Year-over-year growth 2025-2030 (%)

12.7 Middle East and Africa - Market size and forecast 2025-2030

Chart on Middle East and Africa - Market size and forecast 2025-2030 ($ million)
Data Table on Middle East and Africa - Market size and forecast 2025-2030 ($ million)
Chart on Middle East and Africa - Year-over-year growth 2025-2030 (%)
Data Table on Middle East and Africa - Year-over-year growth 2025-2030 (%)
Chart on Regional Comparison - Middle East and Africa
Data Table on Regional Comparison - Middle East and Africa

12.7.1 Saudi Arabia - Market size and forecast 2025-2030

Chart on Saudi Arabia - Market size and forecast 2025-2030 ($ million)
Data Table on Saudi Arabia - Market size and forecast 2025-2030 ($ million)
Chart on Saudi Arabia - Year-over-year growth 2025-2030 (%)
Data Table on Saudi Arabia - Year-over-year growth 2025-2030 (%)

12.7.2 UAE - Market size and forecast 2025-2030

Chart on UAE - Market size and forecast 2025-2030 ($ million)
Data Table on UAE - Market size and forecast 2025-2030 ($ million)
Chart on UAE - Year-over-year growth 2025-2030 (%)
Data Table on UAE - Year-over-year growth 2025-2030 (%)

12.7.3 South Africa - Market size and forecast 2025-2030

Chart on South Africa - Market size and forecast 2025-2030 ($ million)
Data Table on South Africa - Market size and forecast 2025-2030 ($ million)
Chart on South Africa - Year-over-year growth 2025-2030 (%)
Data Table on South Africa - Year-over-year growth 2025-2030 (%)

12.7.4 Israel - Market size and forecast 2025-2030

Chart on Israel - Market size and forecast 2025-2030 ($ million)
Data Table on Israel - Market size and forecast 2025-2030 ($ million)
Chart on Israel - Year-over-year growth 2025-2030 (%)
Data Table on Israel - Year-over-year growth 2025-2030 (%)

12.7.5 Turkey - Market size and forecast 2025-2030

Chart on Turkey - Market size and forecast 2025-2030 ($ million)
Data Table on Turkey - Market size and forecast 2025-2030 ($ million)
Chart on Turkey - Year-over-year growth 2025-2030 (%)
Data Table on Turkey - Year-over-year growth 2025-2030 (%)

12.8 Market opportunity by geography

Market opportunity by geography ($ million)
Data Tables on Market opportunity by geography ($ million)

13. Drivers, Challenges, and Opportunity

13.1 Market drivers

Improved capacity and performance of lithium-ion battery
Shift of automotive industry toward EVs
Decline in costs of lithium-ion batteries

13.2 Market challenges

Restrictions on transporting lithium-ion batteries by air
Safety concerns related to lithium-ion batteries
Demand-supply gap of 21700 lithium-ion battery components

13.3 Impact of drivers and challenges

Impact of drivers and challenges in 2025 and 2030

13.4 Market opportunities

Rise in battery recycling initiatives
EV charging with vehicle-to-grid technology
Growing shift to higher energy density cells

14. Competitive Landscape

14.1 Overview

14.2

Overview on criticality of inputs and factors of differentiation

14.3 Landscape disruption

Overview on factors of disruption

14.4 Industry risks

Impact of key risks on business

15. Competitive Analysis

15.1 Companies profiled

Companies covered

15.2 Company ranking index

15.3 Market positioning of companies

Matrix on companies position and classification

15.4 CBAK Energy Technology Inc.

CBAK Energy Technology Inc. - Overview
CBAK Energy Technology Inc. - Product / Service
CBAK Energy Technology Inc. - Key offerings
SWOT

15.5 Cham Battery Technology Co.

Cham Battery Technology Co. - Overview
Cham Battery Technology Co. - Product / Service
Cham Battery Technology Co. - Key offerings
SWOT

15.6 DLG Battery Co. Ltd.

DLG Battery Co. Ltd. - Overview
DLG Battery Co. Ltd. - Product / Service
DLG Battery Co. Ltd. - Key offerings
SWOT

15.7 E One Moli Energy Corp.

E One Moli Energy Corp. - Overview
E One Moli Energy Corp. - Product / Service
E One Moli Energy Corp. - Key offerings
SWOT

15.8 EVE Energy Co. Ltd.

EVE Energy Co. Ltd. - Overview
EVE Energy Co. Ltd. - Business segments
EVE Energy Co. Ltd. - Key offerings
EVE Energy Co. Ltd. - Segment focus
SWOT

15.9 Jiangsu Highstar Battery Co.

Jiangsu Highstar Battery Co. - Overview
Jiangsu Highstar Battery Co. - Product / Service
Jiangsu Highstar Battery Co. - Key offerings
SWOT

15.10 LG Energy Solution Ltd.

LG Energy Solution Ltd. - Overview
LG Energy Solution Ltd. - Product / Service
LG Energy Solution Ltd. - Key news
LG Energy Solution Ltd. - Key offerings
SWOT

15.11 Murata Manufacturing Co. Ltd.

Murata Manufacturing Co. Ltd. - Overview
Murata Manufacturing Co. Ltd. - Business segments
Murata Manufacturing Co. Ltd. - Key offerings
Murata Manufacturing Co. Ltd. - Segment focus
SWOT

15.12 Panasonic Holdings Corp.

Panasonic Holdings Corp. - Overview
Panasonic Holdings Corp. - Business segments
Panasonic Holdings Corp. - Key news
Panasonic Holdings Corp. - Key offerings
Panasonic Holdings Corp. - Segment focus
SWOT

15.13 Samsung SDI Co. Ltd.

Samsung SDI Co. Ltd. - Overview
Samsung SDI Co. Ltd. - Business segments
Samsung SDI Co. Ltd. - Key news
Samsung SDI Co. Ltd. - Key offerings
Samsung SDI Co. Ltd. - Segment focus
SWOT

15.14 Shenzhen BAK Battery Co. Ltd.

Shenzhen BAK Battery Co. Ltd. - Overview
Shenzhen BAK Battery Co. Ltd. - Product / Service
Shenzhen BAK Battery Co. Ltd. - Key offerings
SWOT

15.15 Shenzhen Sinowatt Power Co.

Shenzhen Sinowatt Power Co. - Overview
Shenzhen Sinowatt Power Co. - Product / Service
Shenzhen Sinowatt Power Co. - Key offerings
SWOT

15.16 Sunwoda Electronic Co. Ltd.

Sunwoda Electronic Co. Ltd. - Overview
Sunwoda Electronic Co. Ltd. - Business segments
Sunwoda Electronic Co. Ltd. - Key offerings
Sunwoda Electronic Co. Ltd. - Segment focus
SWOT

15.17 Tenpower Supply Co. Ltd.

Tenpower Supply Co. Ltd. - Overview
Tenpower Supply Co. Ltd. - Product / Service
Tenpower Supply Co. Ltd. - Key offerings
SWOT

15.18 TianJin Lishen Battery Ltd.

TianJin Lishen Battery Ltd. - Overview
TianJin Lishen Battery Ltd. - Product / Service
TianJin Lishen Battery Ltd. - Key offerings
SWOT

16. Appendix

16.1 Scope of the report

Market definition
Objectives
Notes and caveats

16.2 Inclusions and exclusions checklist

Inclusions checklist
Exclusions checklist

16.3 Currency conversion rates for US$

16.4 Research methodology

16.5 Data procurement

Information sources

16.6 Data validation

16.7 Validation techniques employed for market sizing

16.8 Data synthesis

16.9 360 degree market analysis

16.10 List of abbreviations

Research Methodology

Technavio presents a detailed picture of the market by way of study, synthesis, and summation of data from multiple sources. The analysts have presented the various facets of the market with a particular focus on identifying the key industry influencers. The data thus presented is comprehensive, reliable, and the result of extensive research, both primary and secondary.

INFORMATION SOURCES

Primary sources

  • Manufacturers and suppliers
  • Channel partners
  • Industry experts
  • Strategic decision makers

Secondary sources

  • Industry journals and periodicals
  • Government data
  • Financial reports of key industry players
  • Historical data
  • Press releases

DATA ANALYSIS

Data Synthesis

  • Collation of data
  • Estimation of key figures
  • Analysis of derived insights

Data Validation

  • Triangulation with data models
  • Reference against proprietary databases
  • Corroboration with industry experts

REPORT WRITING

Qualitative

  • Market drivers
  • Market challenges
  • Market trends
  • Five forces analysis

Quantitative

  • Market size and forecast
  • Market segmentation
  • Geographical insights
  • Competitive landscape

Interested in this report?

Get your sample now to see our research methodology and insights!

Download Now

Frequently Asked Questions

21700 Lithium-ion Battery market growth will increase by USD 12254.8 million during 2026-2030.

The 21700 Lithium-ion Battery market is expected to grow at a CAGR of 25.8% during 2026-2030.

21700 Lithium-ion Battery market is segmented by Application (Automotive, Consumer electronics, Others) Type (Lithium nickel manganese cobalt, Lithium titanate, Lithium iron phosphate, Lithium cobalt oxide) Distribution channel (Offline, Online)

Ace Battery Co. Ltd., CBAK Energy Technology Inc., Cham Battery Technology Co., DLG Battery Co. Ltd., E One Moli Energy Corp., EVE Energy Co. Ltd., Godi India Pvt. Ltd., Howell Energy Co. Ltd., Jiangsu Highstar Battery Co., LG Energy Solution Ltd., Murata Manufacturing Co. Ltd., Nanotech Energy Inc., Panasonic Holdings Corp., Samsung SDI Co. Ltd., Shenzhen BAK Battery Co. Ltd., Shenzhen Sinowatt Power Co., Sunwoda Electronic Co. Ltd., Tenpower Supply Co. Ltd., TianJin Lishen Battery Ltd., Ufine Technology Co. Ltd. are a few of the key vendors in the 21700 Lithium-ion Battery market.

APAC will register the highest growth rate of 50.8% among the other regions. Therefore, the 21700 Lithium-ion Battery market in APAC is expected to garner significant business opportunities for the vendors during the forecast period.

China, India, South Korea, Japan, Australia, Indonesia, Germany, UK, France, Italy, Spain, The Netherlands, US, Canada, Mexico, Brazil, Argentina, Chile, Saudi Arabia, UAE, South Africa, Israel, Turkey

  • Improved capacity and performance of lithium-ion battery is the driving factor this market.

The 21700 Lithium-ion Battery market vendors should focus on grabbing business opportunities from the Application segment as it accounted for the largest market share in the base year.
RIA - Research AI Assistant
Ask RIA